 Rimani
Condizioni di trading
Strumenti


The index is doing a breakout of the resistance level at 92.10, which is currently finding dynamic resistance in the 200 SMA at H1 chart. That area should cap further gains in order to perform a pullback towards the support zone of 91.68. A consolidation below that level should expose the 91.13 level. MACD indicator is entering the overbought territory.
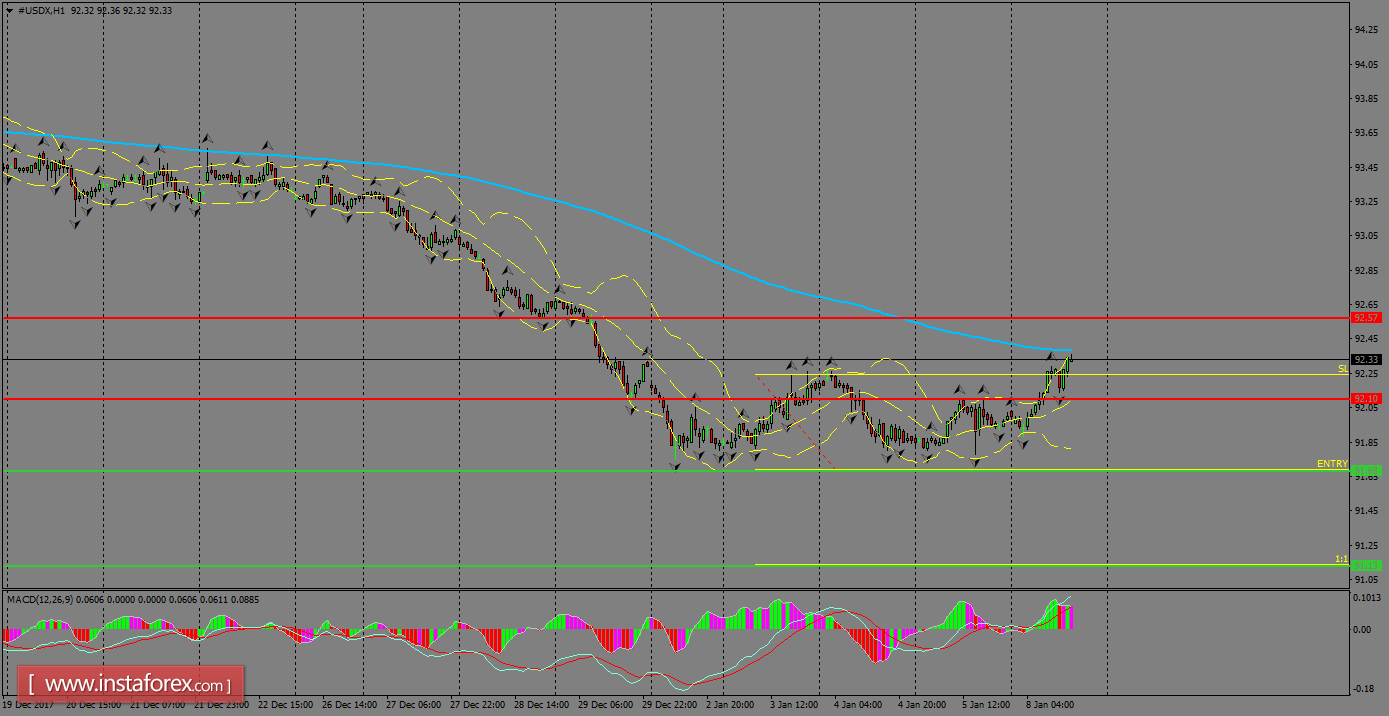
H1 chart's resistance levels: 92.10 / 92.57
H1 chart's support levels: 91.68 / 91.13
Trading recommendations for today: Based on the H1 chart, place sell (short) orders only if the USD Index breaks with a bearish candlestick; the support level is at 91.68, take profit is at 91.13 and stop loss is at 92.24.
Le recensioni analitiche di InstaForex ti renderanno pienamente consapevole delle tendenze del mercato! Essendo un cliente InstaForex, ti viene fornito un gran numero di servizi gratuiti per il trading efficiente.


