 Zůstat
Obchodní podmínky
Nástroje

The index is doing a breakout of the resistance level at 92.10, which is currently finding dynamic resistance in the 200 SMA at H1 chart. That area should cap further gains in order to perform a pullback towards the support zone of 91.68. A consolidation below that level should expose the 91.13 level. MACD indicator is entering the overbought territory.
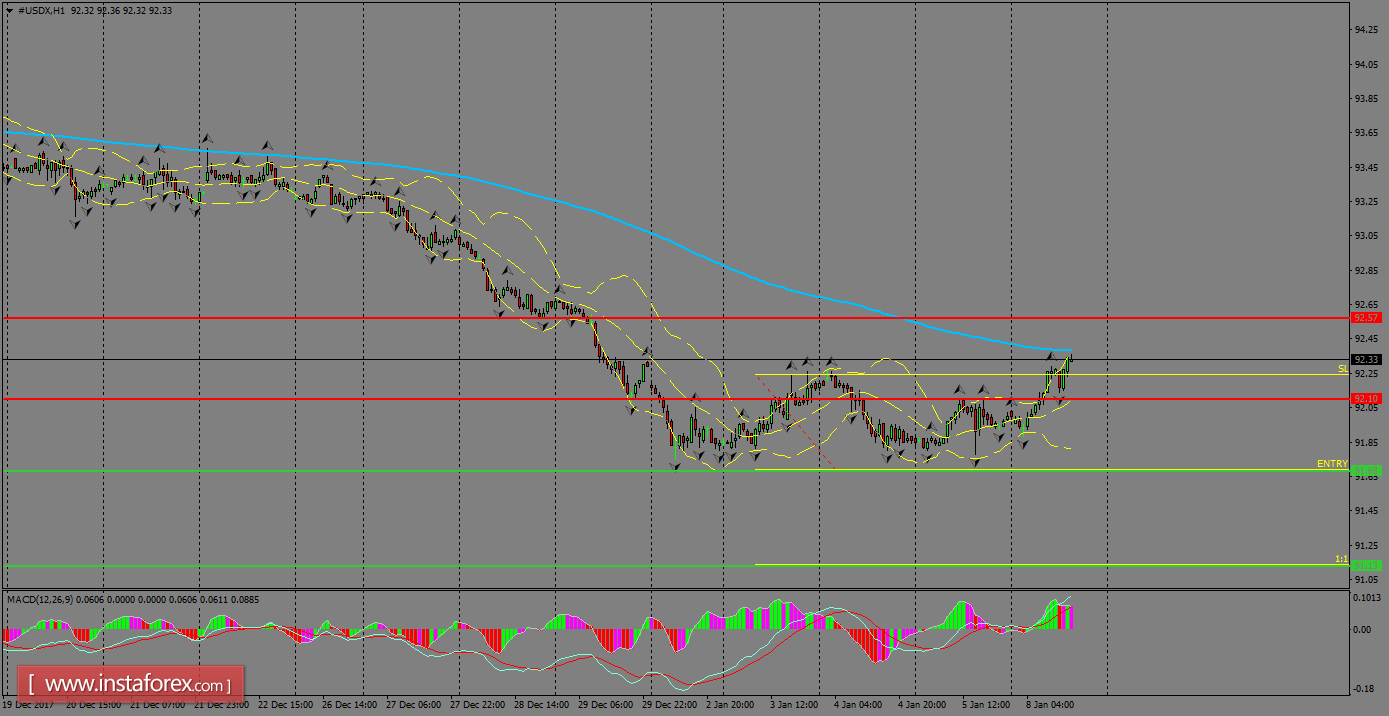
H1 chart's resistance levels: 92.10 / 92.57
H1 chart's support levels: 91.68 / 91.13
Trading recommendations for today: Based on the H1 chart, place sell (short) orders only if the USD Index breaks with a bearish candlestick; the support level is at 91.68, take profit is at 91.13 and stop loss is at 92.24.
Díky analytickým přehledům společnosti InstaForex získáte plné povědomi o tržních trendech! Jako zákazníkovi společnosti InstaForex je Vám k dispozici velký počet bezplatných služeb umožňujících efektivní obchodování.


