 Rimani
Condizioni di trading
Strumenti


Trend analysis.
This week, the price will move up with the first target of 1.1076 – resistance line (red bold line). Breaking through the top of this level or rebounding down from this level will be a strong start to determine the future trend of the market.
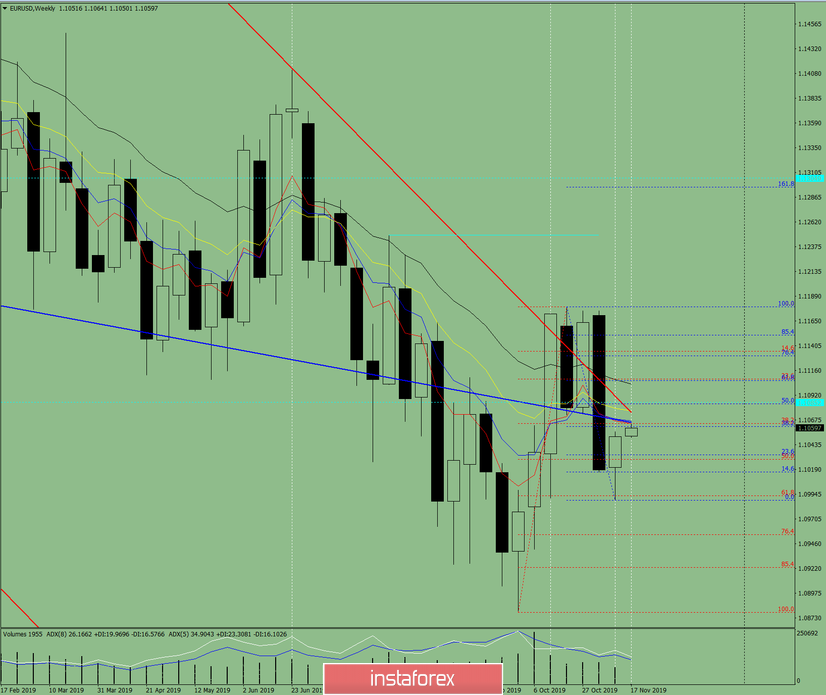
Fig. 1 (weekly chart).
Comprehensive analysis:
- Indicator analysis – up;
- Fibonacci levels – up;
- Volumes – up;
- Candle analysis – neutral;
- Trend analysis – neutral;
- Bollinger Bands – down;
- Monthly chart – down.
The conclusion of comprehensive analysis – an upward movement.
The overall result of calculating the candle of the EUR/USD currency pair according to the weekly chart: the price of the week is likely to have an upward trend, with the absence of the first lower shadow of the weekly white candlestick (Monday – up) and the absence of the second upper shadow (Friday – up).
When breaking up from the resistance line of 1.1075 (red bold line) – the first upper target of 1.1082 is a pullback level of 50.0% (blue dotted line). In case of success (breaking) of the pullback level of 50%, the next upper target of 1.1106 is the pullback level of 61.8% (blue dotted line).
When testing the resistance line of 1.1075 (red bold line) – the first lower target of 1.1028 is a pullback level of 50.0% (red dotted line). If successful, the next lower target is a pullback level of 61.8% – 1.0993 (red dotted line).
Le recensioni analitiche di InstaForex ti renderanno pienamente consapevole delle tendenze del mercato! Essendo un cliente InstaForex, ti viene fornito un gran numero di servizi gratuiti per il trading efficiente.


