 Anuluj
Warunki handlowe
Narzędzia


Trend analysis.
This week, the price will move up with the first target of 1.1076 – resistance line (red bold line). Breaking through the top of this level or rebounding down from this level will be a strong start to determine the future trend of the market.
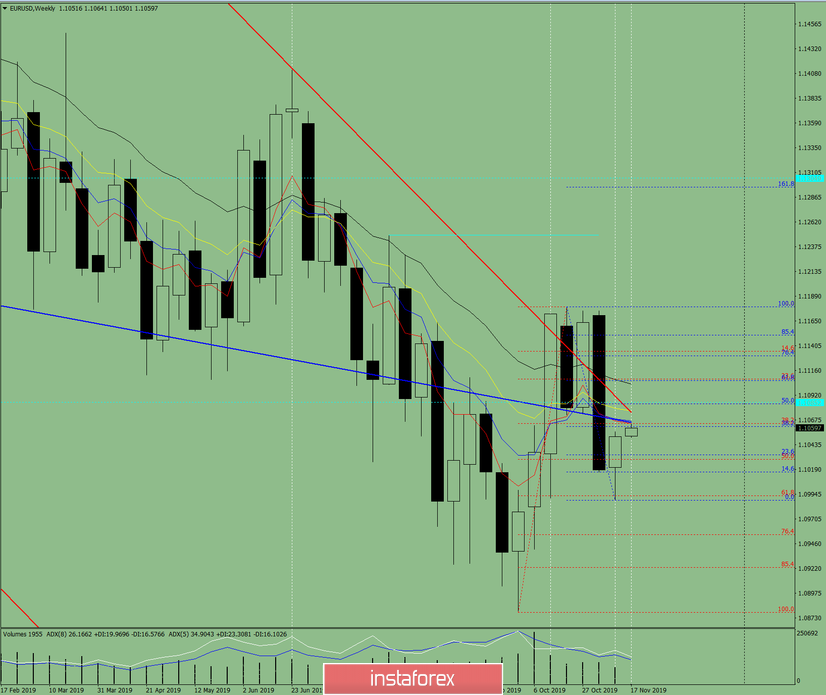
Fig. 1 (weekly chart).
Comprehensive analysis:
- Indicator analysis – up;
- Fibonacci levels – up;
- Volumes – up;
- Candle analysis – neutral;
- Trend analysis – neutral;
- Bollinger Bands – down;
- Monthly chart – down.
The conclusion of comprehensive analysis – an upward movement.
The overall result of calculating the candle of the EUR/USD currency pair according to the weekly chart: the price of the week is likely to have an upward trend, with the absence of the first lower shadow of the weekly white candlestick (Monday – up) and the absence of the second upper shadow (Friday – up).
When breaking up from the resistance line of 1.1075 (red bold line) – the first upper target of 1.1082 is a pullback level of 50.0% (blue dotted line). In case of success (breaking) of the pullback level of 50%, the next upper target of 1.1106 is the pullback level of 61.8% (blue dotted line).
When testing the resistance line of 1.1075 (red bold line) – the first lower target of 1.1028 is a pullback level of 50.0% (red dotted line). If successful, the next lower target is a pullback level of 61.8% – 1.0993 (red dotted line).
Dzięki analizom InstaForex zawsze będziesz na bieżące z trendami rynkowymi! Zarejestruj się w InstaForex i uzyskaj dostęp do jeszcze większej liczby bezpłatnych usług dla zyskownego handlu.

