 Rimani
Condizioni di trading
Strumenti



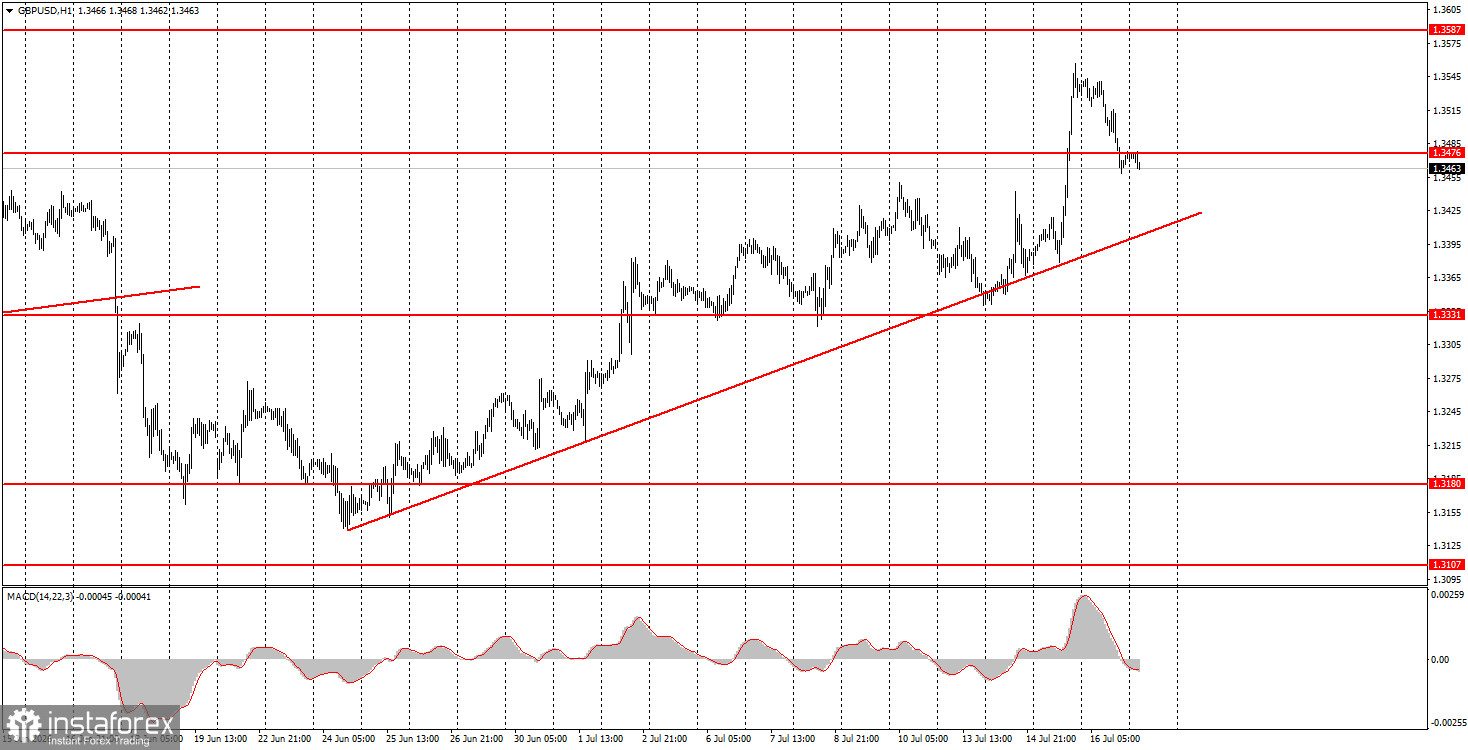
La coppia GBP/USD ha subito una correzione giovedì dopo il forte rialzo del giorno precedente. La sterlina ha perso circa 90 punti. In mattinata nel Regno Unito sono stati pubblicati dati piuttosto modesti sul PIL e sulla produzione industriale di maggio, che in parte hanno spiegato il calo della valuta britannica. Tuttavia, non riteniamo che questi report siano stati la causa principale della discesa. Il PIL di maggio è cresciuto dello 0,1%, come previsto. La produzione industriale è calata dello 0,5%, mentre il mercato si aspettava solo -0,1%. Di fatto, la produzione industriale è stato l'unico dato a penalizzare la sterlina. Tuttavia, è improbabile che abbia innescato un calo di quasi un centesimo. Negli Stati Uniti, il rapporto sulle vendite al dettaglio è risultato neutrale e l'indice di attività economica di Philadelphia ha mostrato 41,4 contro le previsioni di 13. Riteniamo però che la ragione principale del ribasso sia tecnica: la sterlina aveva segnato tre settimane consecutive di rialzi, quindi una correzione tecnica è ciò che serve ora.
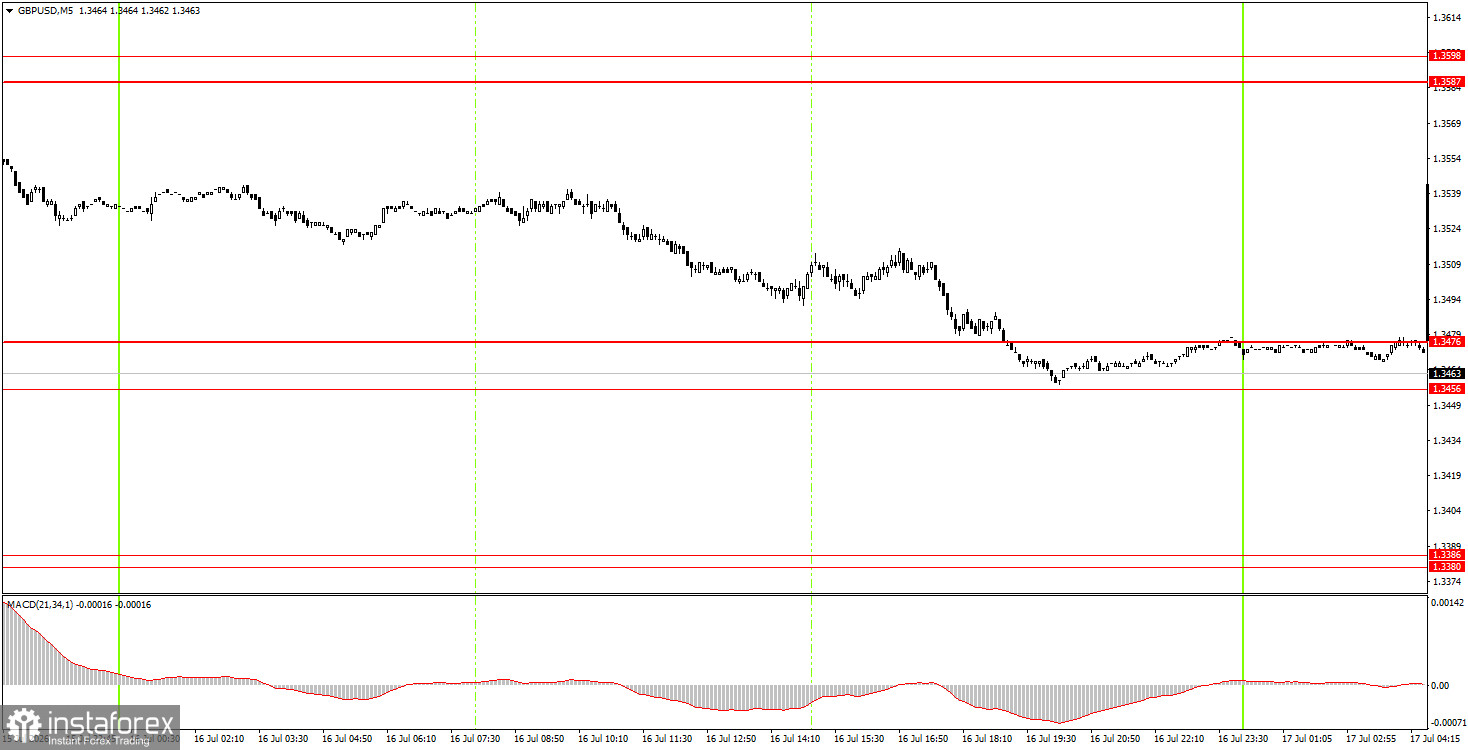
Sul TF a 5 minuti giovedì non si è formato alcun segnale di trading. A fine giornata la coppia ha elaborato l'area 1,3456–1,3476, quindi è probabile che segnali di trading in quest'area emergano solo venerdì.
Sul TF orario la coppia GBP/USD mantiene il trend rialzista in corso da tre settimane. Riteniamo che l'ultimo rialzo della sterlina sia stato un recupero verso un fair value e un movimento tecnico coerente con il canale laterale sui timeframe superiori. La trendline sul grafico orario è stata ricalibrata e continua a sostenere le prospettive di crescita; un consolidamento al di sotto di essa aprirebbe invece la strada a una correzione al ribasso. Un nuovo trend a favore del dollaro, a nostro avviso, si potrebbe verificare solo in caso di ripresa su vasta scala della guerra in Medio Oriente.
Venerdì, i trader principianti possono aprire posizioni short se il prezzo si consolida al di sotto dell'area 1,3456–1,3476 con obiettivo 1,3380–1,3386. Un rimbalzo dalla stessa area 1,3456–1,3476 consentirà invece di aprire long con target 1,3587–1,3598.
Sul TF a 5 minuti i livelli negoziabili sono: 1,3096–1,3107, 1,3175–1,3180, 1,3259–1,3267, 1,3319–1,3331, 1,3380–1,3386, 1,3456–1,3476, 1,3587–1,3598, 1,3631–1,3641, 1,3695. Per venerdì non sono previsti dati rilevanti nel Regno Unito; negli USA usciranno dati sul settore delle costruzioni e l'indice di fiducia dei consumatori dell'Università del Michigan. Non ci aspettiamo movimenti forti, a meno che non accada qualcosa di inaspettato sul fronte geopolitico.
1. La forza del segnale è determinata dal tempo impiegato per la sua formazione (rimbalzo o rottura del livello). Più velocemente si forma, più forte è il segnale.
2. Se due o più operazioni vengono aperte vicino a un certo livello sulla base di falsi segnali, tutti i segnali successivi da quel livello vanno ignorati.
3. In una fase laterale (flat), qualsiasi coppia di valute può generare molti falsi segnali o non generarli affatto. In ogni caso, al primo segno di flat, è meglio smettere di fare trading.
4. Le operazioni si aprono nel periodo compreso tra l'inizio della sessione europea e la metà di quella americana; dopodiché tutte le posizioni devono essere chiuse manualmente.
5. Sul grafico a 1 ora, si può fare trading utilizzando i segnali dell'indicatore MACD solo se c'è una buona volatilità e una tendenza, confermata dalla linea di tendenza o dal canale di tendenza.
6. Se due livelli si trovano troppo vicini tra loro (da 5 a 20 punti), dovrebbero essere considerati come un'area di supporto o resistenza.
7. Dopo un movimento di 15 punti nella direzione corretta, è opportuno impostare lo Stop Loss al punto di pareggio.
I livelli di supporto e resistenza sono livelli che servono da target quando si aprono ordini di acquisto o di vendita. I livelli Take Profit possono essere impostati vicino ad essi;
Le linee rosse sono canali o linee di tendenza che mostrano la tendenza attuale e indicano in quale direzione è preferibile fare trading adesso;
L'indicatore MACD (14,22,3) - istogramma e linea di segnale - è un indicatore ausiliario che può essere utilizzato anche come fonte di segnali.
Interventi e rapporti importanti (sono sempre presenti nel calendario delle notizie) possono influenzare fortemente il movimento della coppia di valute. Pertanto, durante la loro pubblicazione, è consigliabile operare con estrema cautela o uscire dal mercato per evitare una brusca inversione di prezzo rispetto al movimento precedente.
I principianti nel trading Forex dovrebbero ricordare che non tutte le operazioni possono essere redditizie. L'elaborazione di una strategia chiara e la gestione del denaro sono la chiave del successo nel trading a lungo termine.
Le recensioni analitiche di InstaForex ti renderanno pienamente consapevole delle tendenze del mercato! Essendo un cliente InstaForex, ti viene fornito un gran numero di servizi gratuiti per il trading efficiente.


