empty
 
 
Chystáte se opustit
www.instaforex.eu >
stránku provozovanou společností
INSTANT TRADING EU LTD
Otevřít účet

17.07.202605:25 Forex Analysis & Reviews: How to Trade the GBP/USD Currency Pair on July 17? Simple Tips and Trade Analysis for Beginners

Relevance až do 23:00 2026-07-17 UTC--4
Tyto informace jsou v rámci marketingové komunikace poskytovány retailovým i profesionálním klientům. Neobsahují investiční rady a doporučení, nabídky k nebo žádosti o účast na jakékoli transakci nebo strategii spojené s finančními nástroji a neměly by tak být chápány. Předchozí výkon není zárukou ani predikcí budoucího výkonu. Instant Trading EU Ltd. neručí a nezodpovídá za přesnost nebo úplnost poskytnutých informací, ani za ztrátu vyplývající z jakékoliv investice na základě analýzy, předpovědi nebo jiných informací poskytnutých zaměstnancem společnosti nebo jiným způsobem. Úplné znění Odmítnutí odpovědnosti je k dispozici zde.

Trade Analysis for Thursday:

1H Chart of GBP/USD

Exchange Rates 17.07.2026 analysis

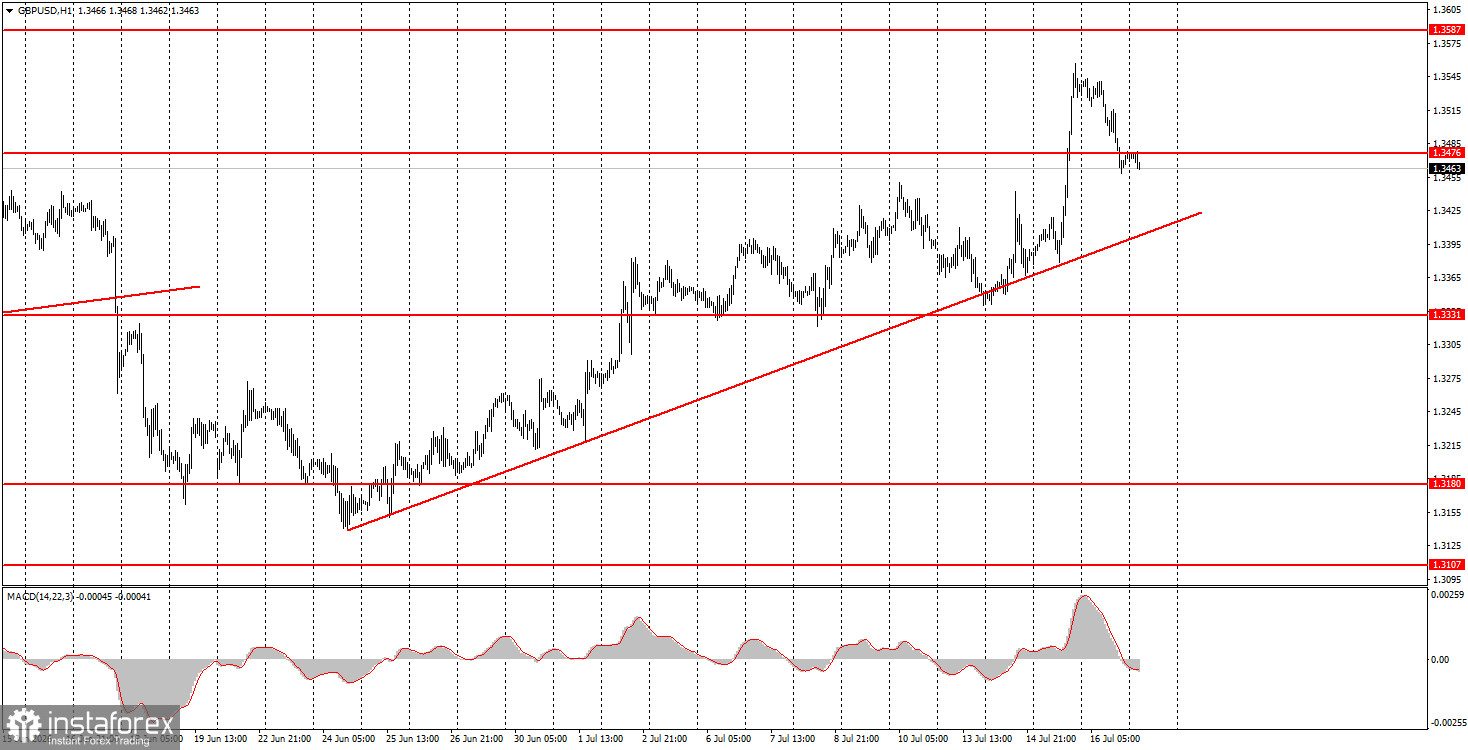
The GBP/USD pair corrected on Thursday after a significant rise the day before. The British pound lost approximately 90 pips. In the morning, relatively mediocre GDP and industrial production data for May were published in the UK, which partially triggered the decline of the British currency. However, we do not consider these reports to be the main reason for the fall. The GDP in May was +0.1%, as expected. Industrial production declined by 0.5%, although traders had anticipated only a 0.1% drop. Essentially, it was the industrial production figure that worked against the pound sterling. However, it is unlikely to cause a decline of nearly 1 cent. In the U.S., the retail sales report was neutral, while the Philadelphia Fed business index showed a value of 41.4 against forecasts of 13. However, we believe that the main reason for the pair's decline is technical. The pound sterling has been rising for three consecutive weeks, so a technical correction is what is needed right now.

5M Chart of GBP/USD

Exchange Rates 17.07.2026 analysis

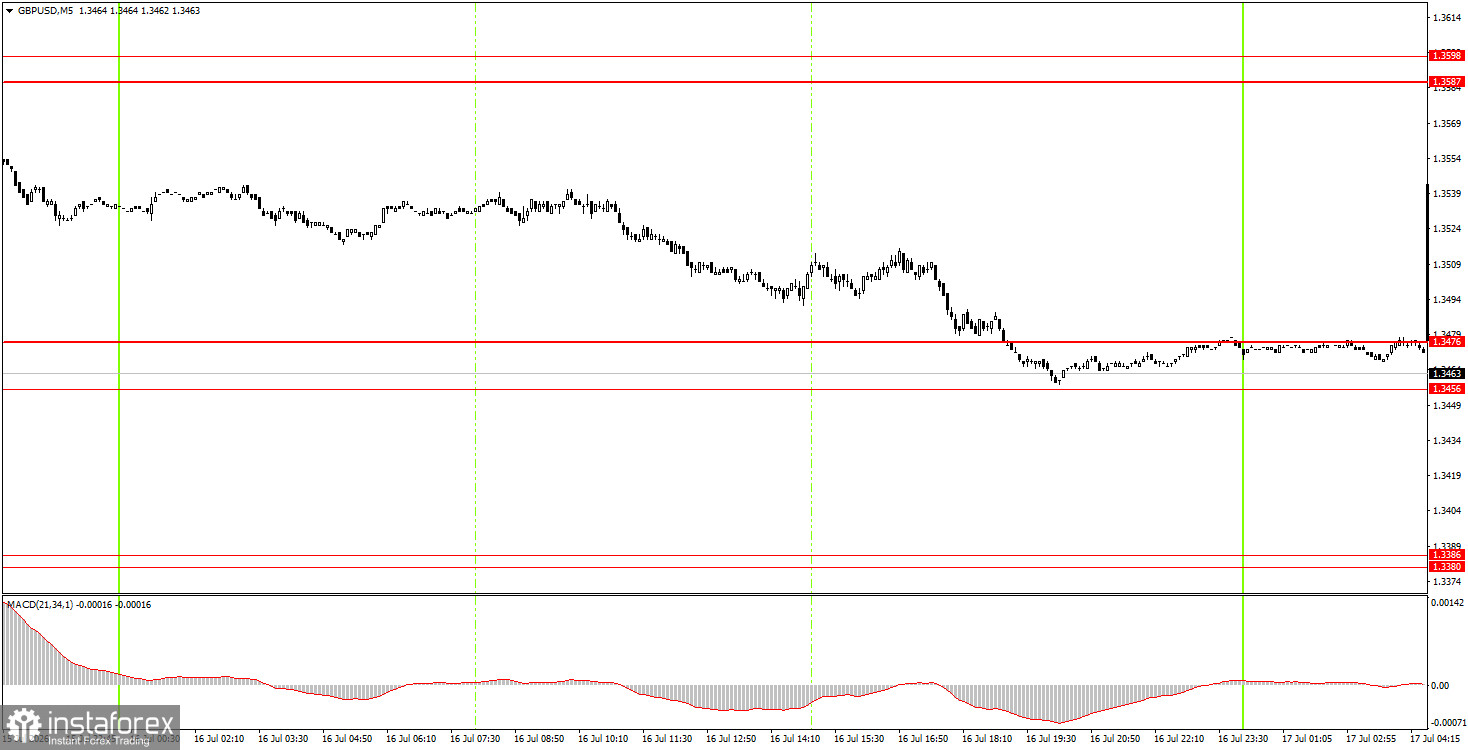
On the 5-minute timeframe, no trading signals were formed on Thursday. Only by the end of the day did the pair test the 1.3456-1.3476 area, so trading signals may only form in this area on Friday.

How to Trade on Friday:

On the hourly timeframe, the GBP/USD pair continues its three-week upward trend. We believe that the last rise of the pound is a recovery of fair value and a technical movement justified by the sideways channel on higher timeframes. The trend line on the hourly timeframe has been redrawn and again supports growth prospects. A consolidation below it would allow the pair to begin a downward correction. A new dollar trend, in our view, can only be expected in the event of a resumption of full-scale war in the Middle East.

On Friday, novice traders may open short positions with targets at 1.3380-1.3386 if the price consolidates below the 1.3456-1.3476 area. A bounce from the 1.3456-1.3476 area will allow for new long positions with targets at 1.3587-1.3598.

On the 5-minute timeframe, the following levels can be traded: 1.3096-1.3107, 1.3175-1.3180, 1.3259-1.3267, 1.3319-1.3331, 1.3380-1.3386, 1.3456-1.3476, 1.3587-1.3598, 1.3631-1.3641, and 1.3695. There are no significant publications scheduled in the UK for Friday, while the U.S. will release data on the housing sector and the University of Michigan's consumer sentiment index. We do not expect strong movements today unless something geopolitically unexpected occurs.

Basic Rules of the Trading System:

  1. The strength of a signal is determined by the time required to form it (a bounce or a breakout). The less time taken, the stronger the signal.
  2. If two or more trades were opened at a particular level based on false signals, subsequent signals from that level should be ignored.
  3. In a flat market, any pair may form many false signals or none at all. Technical levels may be disregarded.
  4. On the hourly timeframe, trading signals from the MACD indicator should be executed only when volatility is good, and a trend is confirmed by a trend line or channel.
  5. If two levels are too close together (5 to 20 pips), they should be considered a support or resistance area.
  6. After moving 15 pips in the correct direction, a Stop Loss should be set at breakeven.

What's on the Charts:

Price levels (areas) of support and resistance are targets when opening long or short positions or sources of signals.

Red lines indicate channels or trend lines that display the current trend and indicate the preferred direction for trading.

The MACD indicator (14,22,3) – histogram and signal line – is a supplementary indicator that can also be used as a source of signals.

Important speeches and reports (contained in the news calendar) can significantly impact the movement of the currency pair. Therefore, during their release, trading should be conducted with maximum caution, or one should exit the market to avoid sharp reversals against preceding movements.

Beginners trading in the forex market should remember that not every trade can be profitable. Developing a clear strategy and practicing money management are key to long-term success in trading.

Paolo Greco
analytik InstaForexu
© 2007–2026

Otevřít obchodní účet

Díky analytickým přehledům společnosti InstaForex získáte plné povědomi o tržních trendech! Jako zákazníkovi společnosti InstaForex je Vám k dispozici velký počet bezplatných služeb umožňujících efektivní obchodování.


Nyní opouštíte web www.instaforex.eu, web provozovaný společností INSTANT TRADING EU LTD
Nemůžete právě teď mluvit?
Položte vaši otázku v chatu.
Widget zpětného volání

Turn "Do Not Track" off