empty
 
 
Stai per lasciare
www.instaforex.eu >
il sito gestito da
INSTANT TRADING EU LTD
Apri un conto

28.02.201710:22 Forex Analysis & Reviews: Technical analysis of USDX for February 28, 2017

Revisione a lungo termine
Queste informazioni sono fornite ai clienti al dettaglio e professionisti come parte della comunicazione di marketing. Non contiene e non deve essere interpretata come contenente consigli di investimento o raccomandazioni di investimento o un'offerta o una sollecitazione a impegnarsi in qualsiasi transazione o strategia in strumenti finanziari. Le performance passate non sono una garanzia o una previsione delle performance future. Instant Trading EU Ltd. non rilascia alcuna dichiarazione e non si assume alcuna responsabilità in merito all'accuratezza o completezza delle informazioni fornite, o qualsiasi perdita derivante da qualsiasi investimento basato su analisi, previsioni o altre informazioni fornite da un dipendente della Società o altri. Il disclaimer completo è disponibile qui.

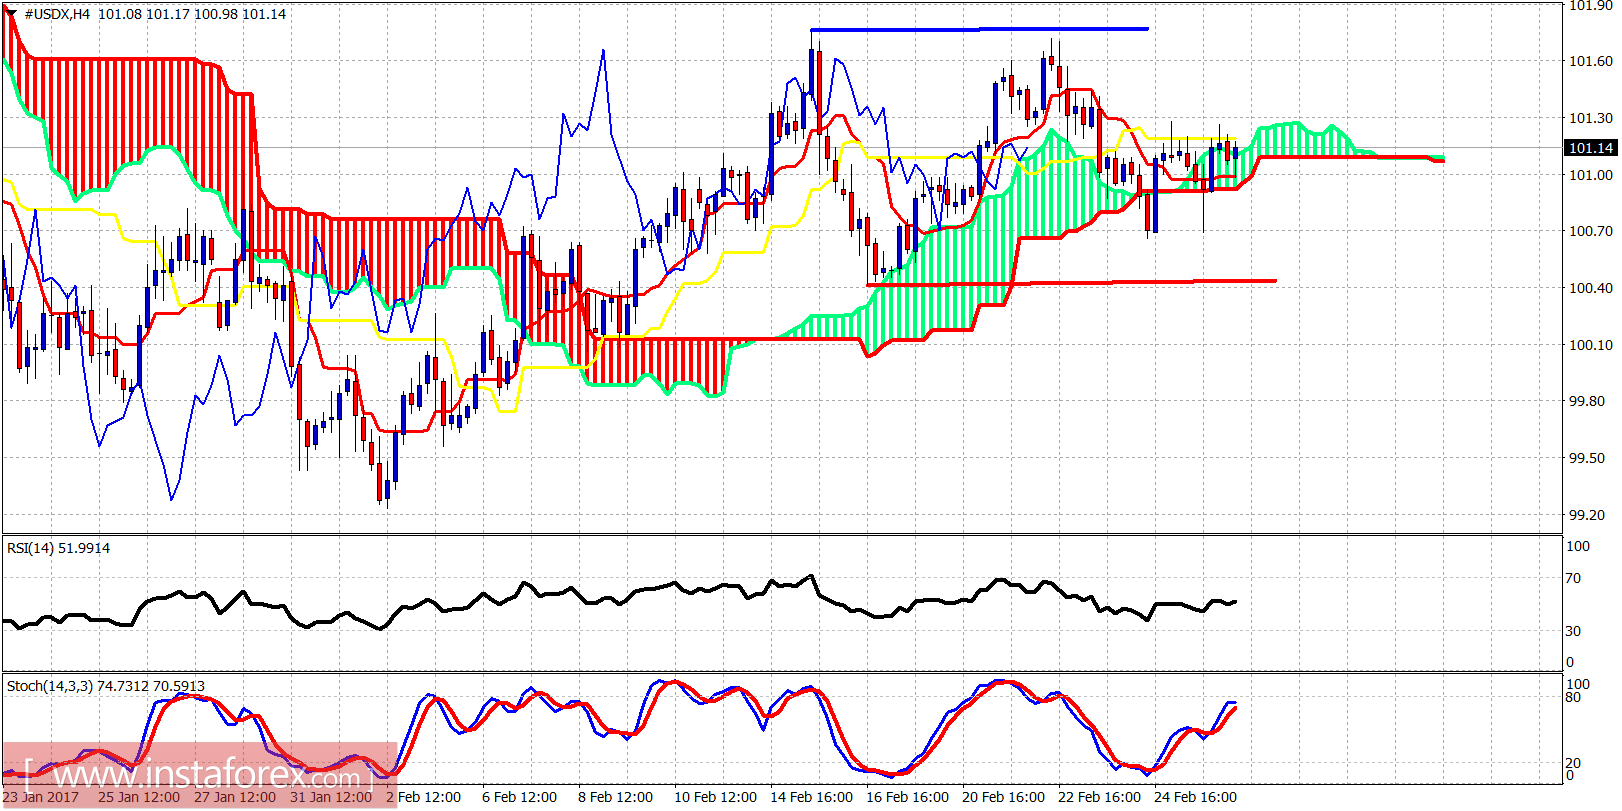
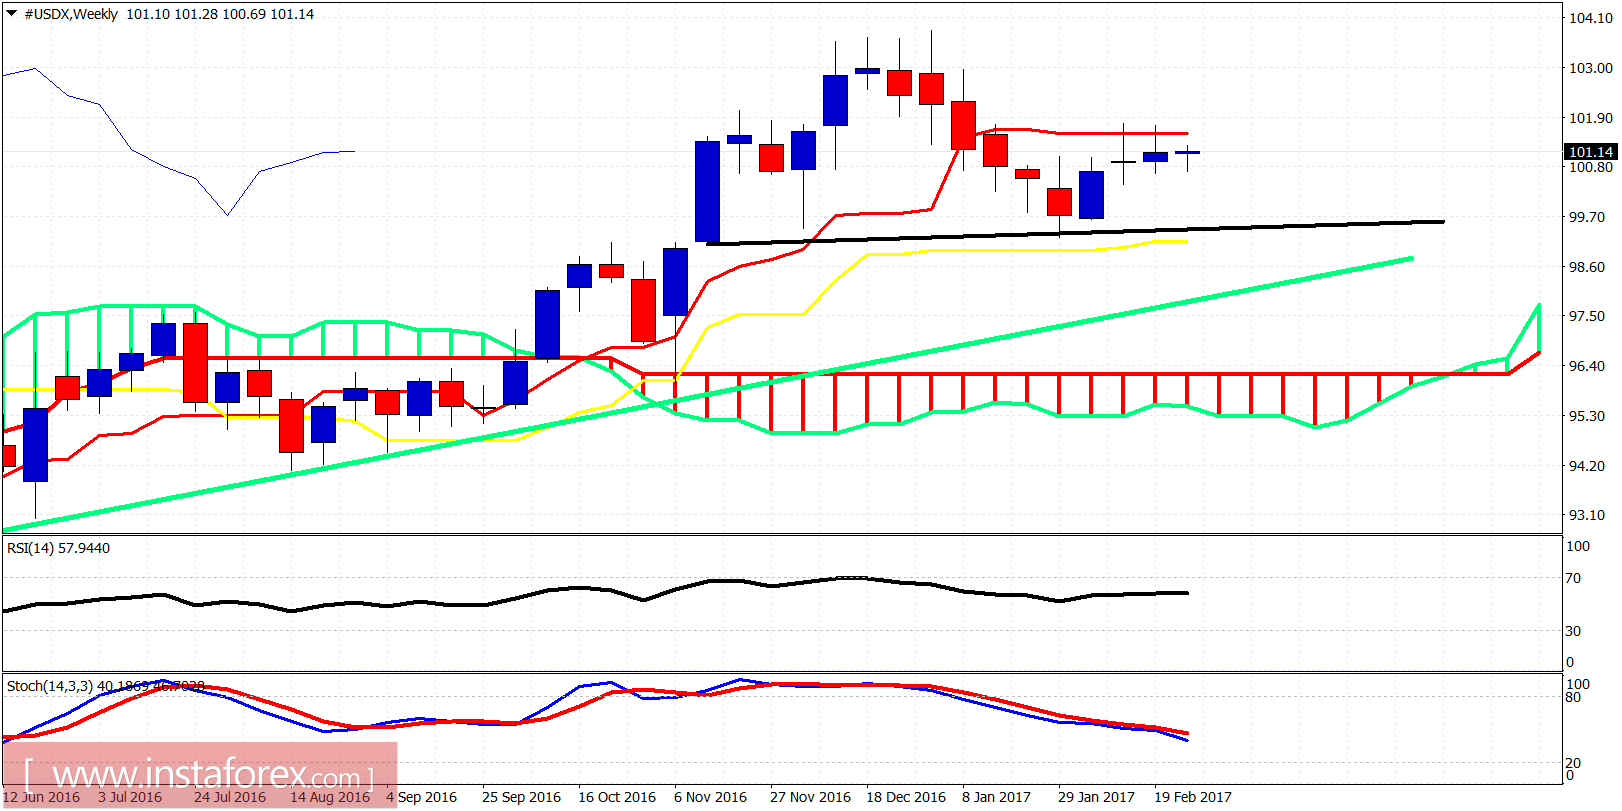
The Dollar index is trading sideways between important resistance of 101.80 and support at 100.40. This indecision is very clearly portrayed in the weekly charts. We are at a very critical junction. Soon we will see if the bullish scenario for new highs gains more chances of success or the bearish scenario of the Head and Shoulders pattern.

Exchange Rates 28.02.2017 analysis

Blue line - resistance

Red line - support

The Dollar index is trading around the 4-hour Ichimoku cloud. This confirms the indecisiveness. Traders need to be patient. Short-term support is at 100.70 and a break below it will increase the chances of breaking 100.40. Resistance is at 101.80.

Exchange Rates 28.02.2017 analysis

Black line - neckline support

Green line - long-term support trendline

The weekly chart remains right below the tenkan-sen (red line indicator). The inability to break above it is not a good sign and increases the chances that we are forming the right hand shoulder of a bearish Head and Shoulders pattern with 99.25 as the neckline and 95 as the target if the neckline breaks. A break however above 102 on a weekly basis will be a bullish sign confirming the low at 99.25 and the target of 105-110.

Eseguito da Alexandros Yfantis
Esperto analista di InstaForex
© 2007-2026

Apri un conto di trading

Le recensioni analitiche di InstaForex ti renderanno pienamente consapevole delle tendenze del mercato! Essendo un cliente InstaForex, ti viene fornito un gran numero di servizi gratuiti per il trading efficiente.


Stai per lasciare www.instaforex.eu, il sito Web gestito da INSTANT TRADING EU LTD
In questo momento non potete parlare al telefono?
Ponete la vostra domanda nella chat.
Widget callback

Turn "Do Not Track" off