empty
 
 
OPUSZCZASZSTRONĘ INTERNETOWĄ
www.instaforex.eu >
firmy
INSTANT TRADING EU LTD
Otwórz konto

28.02.201710:22 Forex Analysis & Reviews: Technical analysis of USDX for February 28, 2017

Przegląd długoterminowy
Informacje te są częścią komunikacji marketingowej i są przeznaczone dla klientów detalicznych i profesjonalnych. Informacje te nie zawierają i nie powinny być interpretowane jako informacje zawierające porady inwestycyjne lub rekomendacje dotyczące inwestycji, a także oferty lub zaproszenia do udziału w dowolnej transakcji, lub strategii dotyczącej instrumentów finansowych. Wcześniejsze zyski nie stanowią gwarancji przyszłych dochodów. Instant Trading EU Ltd nie udziela żadnych gwarancji i nie ponosi żadnej odpowiedzialności za dokładność lub kompletność dostarczonych informacji, a także za jakiekolwiek straty wynikające z inwestycji opartych na analizie, prognozie lub innych informacjach dostarczonych przez pracownika Firmy, lub w jakikolwiek inny sposób. Pełne oświadczenie o wyłączeniu odpowiedzialności jest dostępne tutaj.

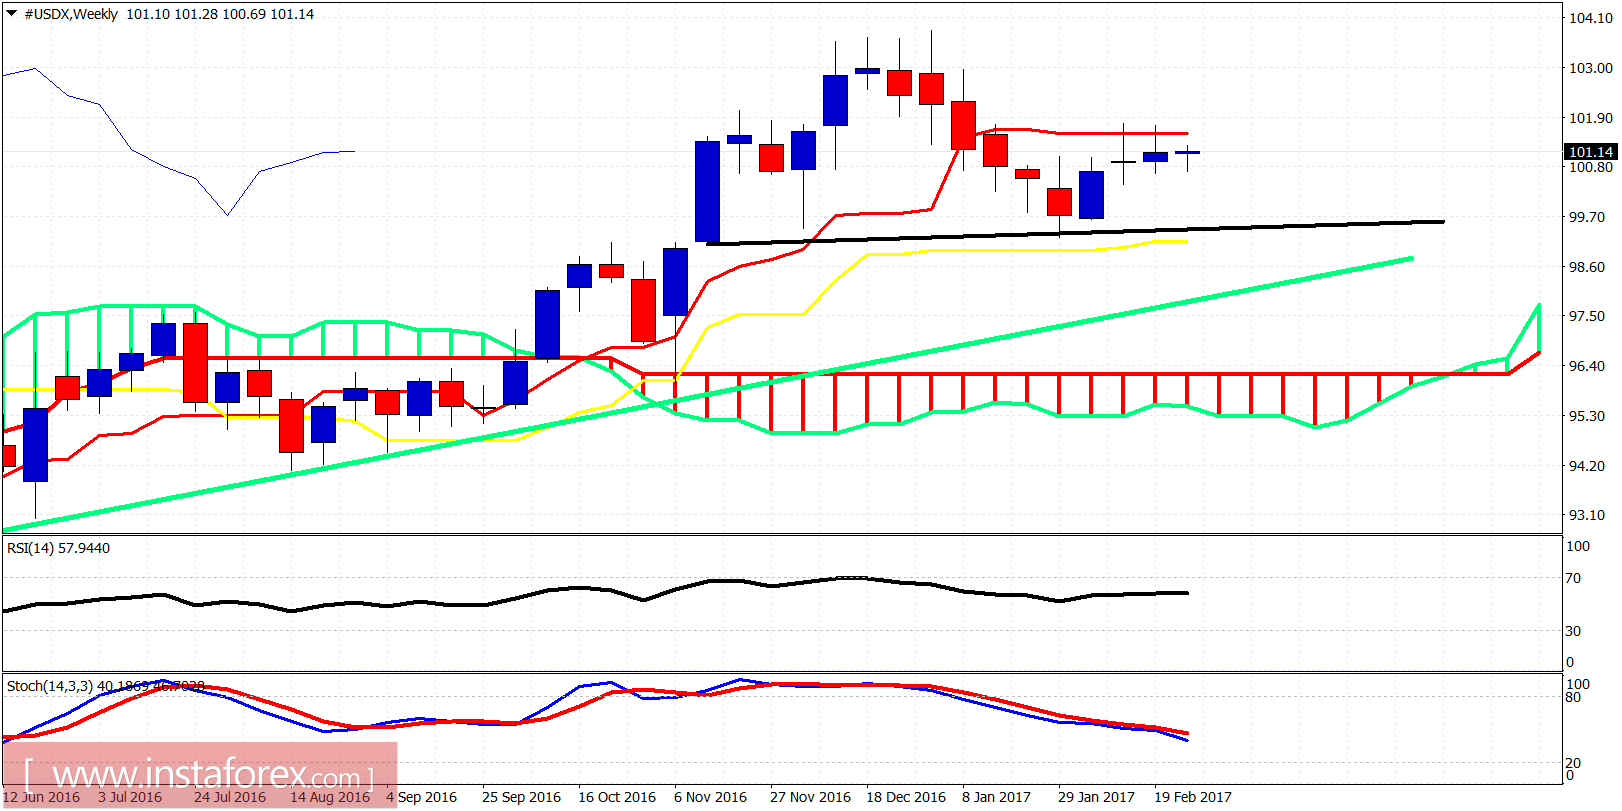
The Dollar index is trading sideways between important resistance of 101.80 and support at 100.40. This indecision is very clearly portrayed in the weekly charts. We are at a very critical junction. Soon we will see if the bullish scenario for new highs gains more chances of success or the bearish scenario of the Head and Shoulders pattern.

Exchange Rates 28.02.2017 analysis

Blue line - resistance

Red line - support

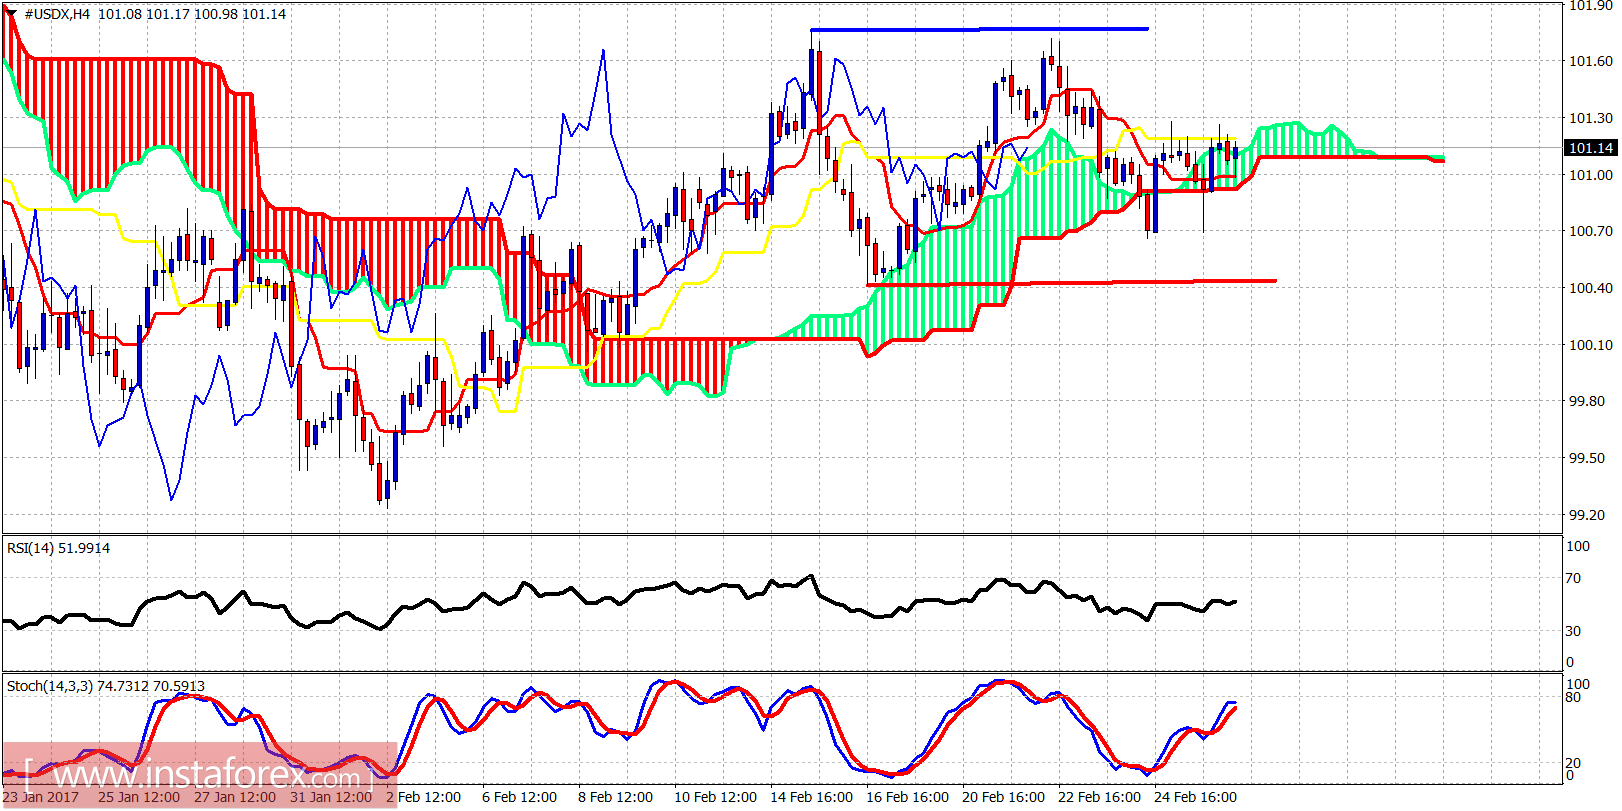
The Dollar index is trading around the 4-hour Ichimoku cloud. This confirms the indecisiveness. Traders need to be patient. Short-term support is at 100.70 and a break below it will increase the chances of breaking 100.40. Resistance is at 101.80.

Exchange Rates 28.02.2017 analysis

Black line - neckline support

Green line - long-term support trendline

The weekly chart remains right below the tenkan-sen (red line indicator). The inability to break above it is not a good sign and increases the chances that we are forming the right hand shoulder of a bearish Head and Shoulders pattern with 99.25 as the neckline and 95 as the target if the neckline breaks. A break however above 102 on a weekly basis will be a bullish sign confirming the low at 99.25 and the target of 105-110.

Przedstawiono Alexandros Yfantis,
przez eksperta analitycznego
z grupy firm InsaForex © 2007-2026
Otwórz konto handlowe w InstaForex

Dzięki analizom InstaForex zawsze będziesz na bieżące z trendami rynkowymi! Zarejestruj się w InstaForex i uzyskaj dostęp do jeszcze większej liczby bezpłatnych usług dla zyskownego handlu.


Opuszczasz stronę internetową www.instaforex.eu firmy INSTANT TRADING EU LTD
Nie możesz teraz rozmawiać przez telefon?
Zadaj pytanie na czacie.
Oddzwonienie

Turn "Do Not Track" off