 Zůstat
Obchodní podmínky
Nástroje


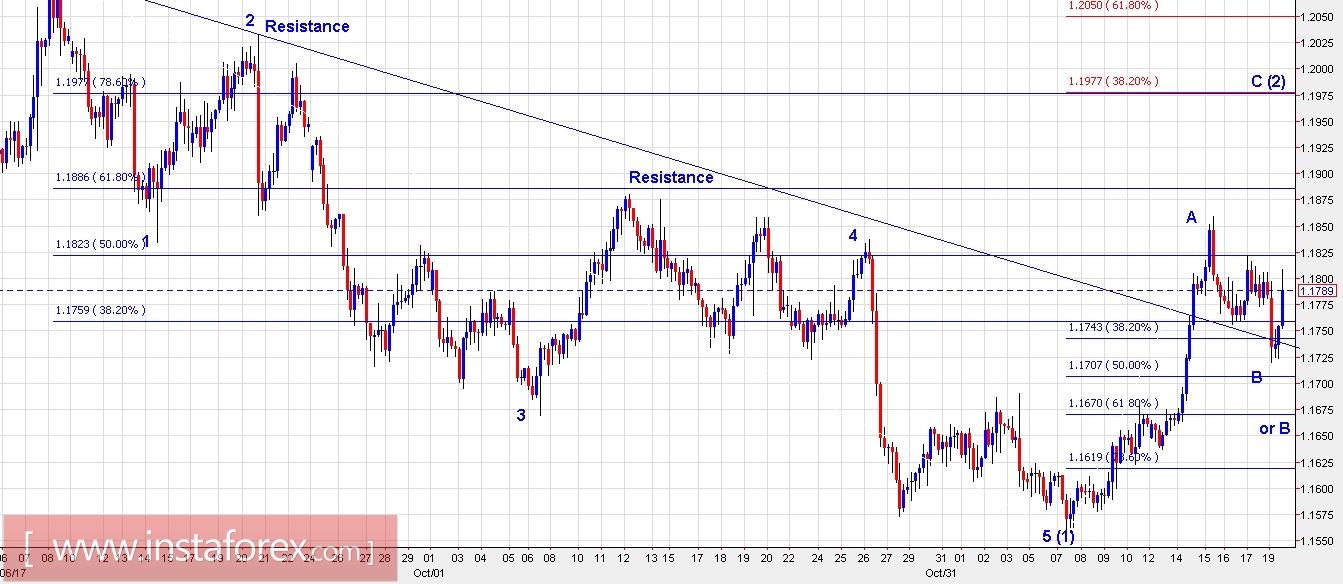
Technical outlook:
The EUR/USD pair is still into its corrective rally that began from 1.1550 levels earlier. It has clearly bounced right at the back side of the trend line resistance as seen here and producing a morning star since then. The overall wave count is still offering 2 probable scenarios. Higher probability scenario suggests the pair has produces a 5 waves leading diagonal from 1.2092 through 1.1500 levels, terminating into wave (1). The subsequent rally is been working to terminate into wave (2), which could potentially reach 1.1975 or 1.2050 levels as shown here (red lines). An alternate scenario suggests that the entire drop from 1.2092 through 1.1500 levels could be corrective (ABC-X-ABC, double zigzag) and that leaves doors open through new highs or another ABC corrective rally before dropping sharply. In both the above scenario, a common point could be a rally at least through 1.1900/50 levels. We would recommend a short term change in the trading plan.
Trading plan:
1. Remain short with a risk above 1.1860 and target 1.1700.
2. Then go long with risk at 1.1550 and target 1.1950.
US Dollar Index chart setups:
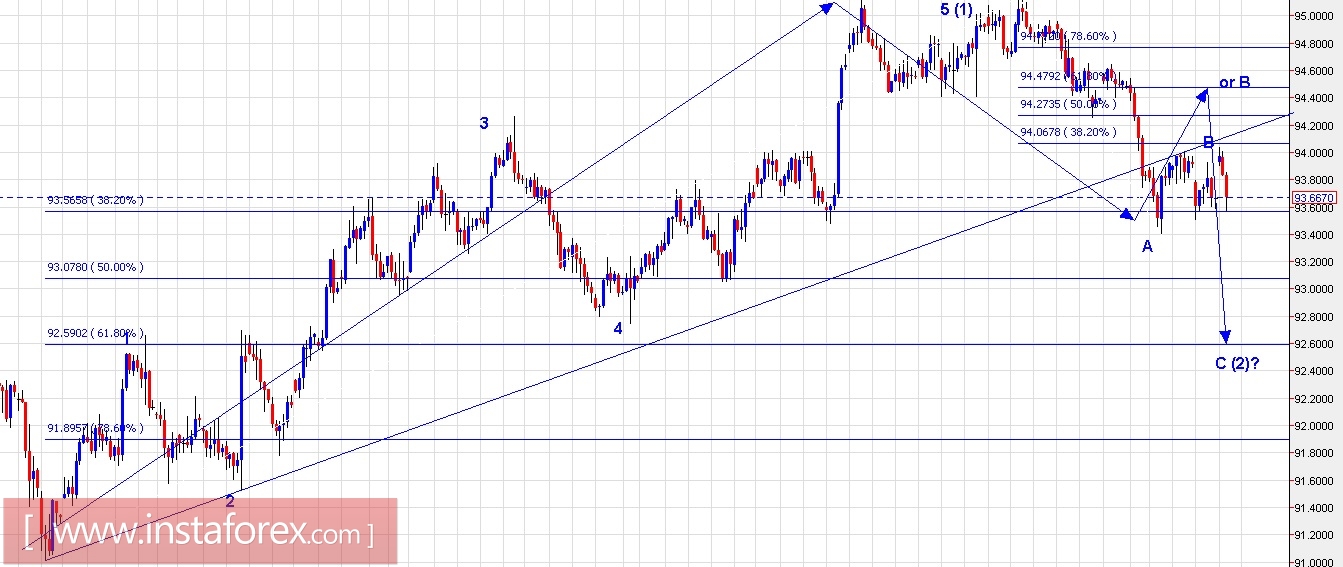
Technical outlook:
The US Dollar Index is supposedly still providing a simple wave count as compared to its counterpart EURUSD. The rally from 91.00 through 95.00/20 levels was unfolded into 5 waves and hence impulse. The subsequent drop after that has found support at the fibonacci 0.382 of the entire rally as seen here. The pair could still extend its rally through 94.50 levels before finding strong resistance and then drop towards 92.60 levels which is fibonacci 0.618 support of the earlier rally. Looking at the entire structure, the US Dollar Index is producing a probable down gartley, within the larger up gartley and hence a classic example of trends and counter trends. Price resistance should be strong around 95.00 levels while support is strong around 92.60 levels respectively.
Trading plan:
1. Remain long from last week with risk below 93.40 targeting 94.50/60
2. Then short with risk above 95.20, targeting 92.80.
Fundamental outlook:
Please watch out for Mr Draghi's speech at Brussels at 09:00 AM and 1100 AM EST today.
Good luck!
Díky analytickým přehledům společnosti InstaForex získáte plné povědomi o tržních trendech! Jako zákazníkovi společnosti InstaForex je Vám k dispozici velký počet bezplatných služeb umožňujících efektivní obchodování.

