Tyto informace jsou v rámci marketingové komunikace poskytovány retailovým i profesionálním klientům. Neobsahují investiční rady a doporučení, nabídky k nebo žádosti o účast na jakékoli transakci nebo strategii spojené s finančními nástroji a neměly by tak být chápány. Předchozí výkon není zárukou ani predikcí budoucího výkonu. Instant Trading EU Ltd. neručí a nezodpovídá za přesnost nebo úplnost poskytnutých informací, ani za ztrátu vyplývající z jakékoliv investice na základě analýzy, předpovědi nebo jiných informací poskytnutých zaměstnancem společnosti nebo jiným způsobem. Úplné znění Odmítnutí odpovědnosti je k dispozici zde.
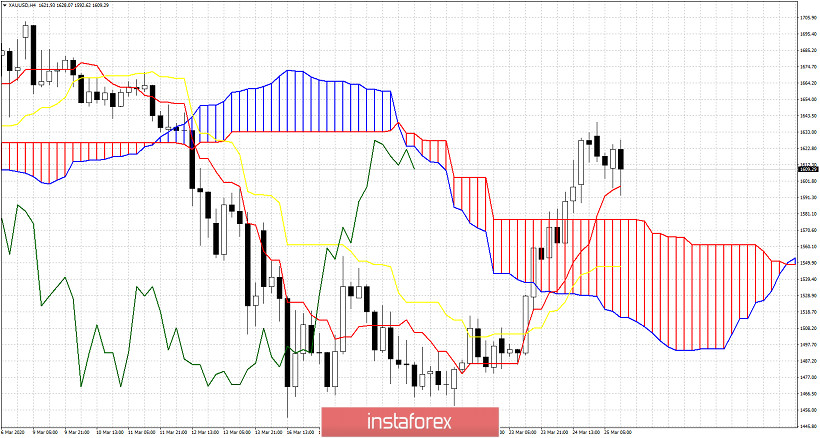
Gold price as explained in our last analysis, has reached important Fibonacci resistance. The resistance area around $1,620-$1,600 is also confirmed by the Ichimoku cloud indicator. What should we expect next?
In the 4 hour chart above we see price above the 4 hour cloud. Short-term trend is bullish again. However the Chikou span (green line indicator) is hitting cloud resistance and shows rejection signs. A 4 hour close below $1,598 (tenkan-sen red line indicator) will open the way for a push towards the cloud support and the upper cloud boundary at $1,577. A pull back and back test of cloud support is justified and should be expected. Next support is at $1.547. Bulls do not want to see price enter the cloud again. Bulls want to see price test cloud support and bounce. This would be a bullish sign.
Díky analytickým přehledům společnosti InstaForex získáte plné povědomi o tržních trendech! Jako zákazníkovi společnosti InstaForex je Vám k dispozici velký počet bezplatných služeb umožňujících efektivní obchodování.
 Zůstat