 Zůstat
Obchodní podmínky
Nástroje


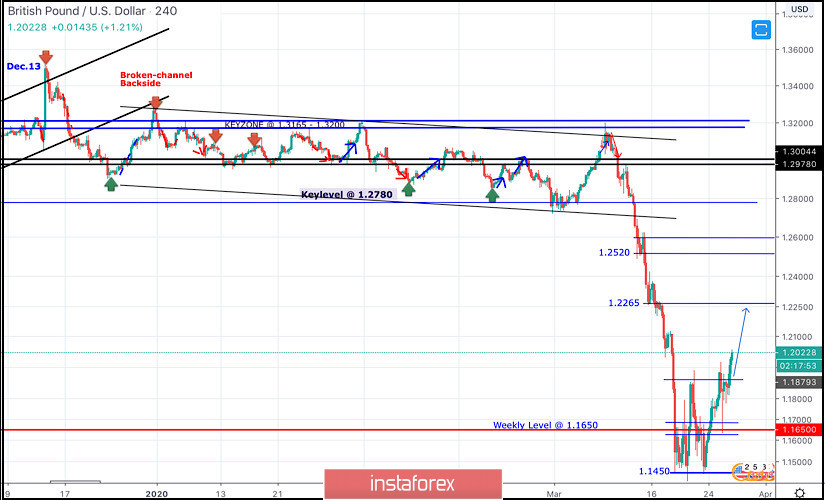
In the period between December 18th - 23rd, bearish breakout below the previous bullish channel followed by quick bearish decline below 1.3000 were demonstrated on the H4 chart.
However, Immediate bullish recovery (around 1.2900) brought the pair back towards 1.3250 (backside of the broken channel) where the recently-terminated wide-ranged movement channel was established below 1.3200.
Since January 13, progressive bearish pressure has been built above the price level of 1.2780-1.2800 until March, the 2nd when transient bearish breakout 1.2780 took place.
Shortly after, significant bullish rejection was demonstrated around 1.2780 on March 4. Hence, a quick bullish movement was expressed towards the price zone of 1.3165-1.3200 where significant bearish pressure brought the pair back below 1.2780, 1.2500 then 1.2260 via quick bearish engulfing H4 candlesticks.
Recently, the GBPUSD has reached new LOW price levels around 1.1450, slightly below the historical low (1.1650) achieved in September 2016 (As depicted on the Weekly Chart).
Recently, the GBP/USD pair looked very OVERSOLD around the price levels of 1.1450 where a double-bottom reversal pattern was recently demonstrated.
Technical outlook will probably turn into bullish if bullish persistence is maintained above 1.1890-1.1900 (Double-Bottom Neckline) on the H4 Charts.
Bullish breakout above 1.1900 (Latest Descending High) invalidates the bearish scenario temporarily & enables higher bullish targets around 1.2260, 1.2520, 1.2680 to be addressed if sufficient bullish momentum is maintained.
On the other hand, H4 Candlestick re-closure below 1.1800 hinders further bullish advancement and enhances the bearish momentum on the short term.
If so, Initial Bearish targets would be located around 1.1650 and 1.1450 provided that quick H4 bearish closure below 1.1800 is achieved.
Trade recommendations :
Intraday traders should be watching for any bearish pullback towards 1.1800 as a valid BUY signal. T/P level to be located around 1.2000 and 1.2265 while S/L should remain tight below 1.0750.
On the other hand, if direct bullish advancement is demonstrated towards 1.2265, signs of bearish rejection should be considered as a valid SELL signal.
Díky analytickým přehledům společnosti InstaForex získáte plné povědomi o tržních trendech! Jako zákazníkovi společnosti InstaForex je Vám k dispozici velký počet bezplatných služeb umožňujících efektivní obchodování.


