 Zůstat
Obchodní podmínky
Nástroje


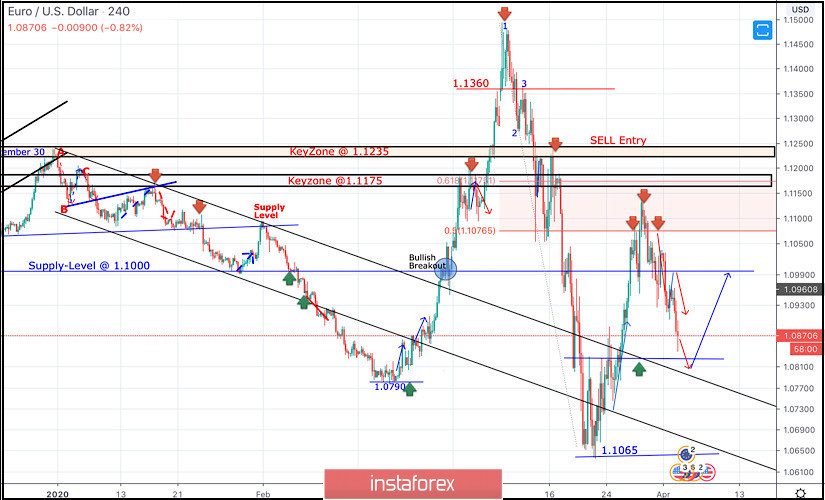
Since December 30, the EURUSD pair has trended-down within the depicted bearish channel until few weeks ago, when a new low around 1.0790 was recently established where the EUR/USD pair looked OVERSOLD after such extensive bearish decline.
On February 20, recent signs of bullish recovery were demonstrated around 1.0790 leading to the recent steep bullish movement towards 1.1000, 1.1175, 1.1360 and finally 1.1480 where a (123) bearish reversal pattern was initiated around.
This turned the short-term technical outlook for the EURUSD pair into bearish when bearish persistence below the Keyzone of 1.1235 was maintained on a daily basis.
Moreover, the mentioned intermediate-term bearish Head & Shoulders pattern has achieved all of its projection target levels.
Earlier last week, the EURUSD pair has expressed significant bullish recovery around 1.1065
The recent bullish engulfing H4 candlesticks as well as the recently-demonstrated ascending bottoms indicated a high probability bullish pullback at least towards 1.0980 and 1.1075 (Fibonacci Level 50%).
Key Supply-Levels in confluence with significant Fibonacci levels are located around 1.1075 (50% Fibonacci) and 1.1175 (61.8% Fibonacci) where bearish rejection was highly-expected.
Moreover, a Head & Shoulders reversal pattern was being demonstrated around the price levels of 1.1075. The pattern neckline existed near the key-level around 1.1000.
Further bearish movement is being demonstrated towards 1.0850 shortly after the neckline of the reversal pattern was breached to the downside.
The nearest demand level to be considered is located near the backside of the broken channel around 1.0850-1.0820 where bullish rejection may exist soon.
Trade recommendations :
Intraday traders can wait for more bearish pullback towards the mentioned demand-zone around 1.0820-1.0850 and look for any bullish rejection signs as a valid BUY signal for a short-term trade.
S/L to be placed below 1.0780 while Initial T/P level to be located around 1.0920 and 1.1000.
Díky analytickým přehledům společnosti InstaForex získáte plné povědomi o tržních trendech! Jako zákazníkovi společnosti InstaForex je Vám k dispozici velký počet bezplatných služeb umožňujících efektivní obchodování.

