 Zůstat
Obchodní podmínky
Nástroje

Gold price has broken above $1,750 and is heading towards our target of $1,780. Price is breaking above the trading range its been in for the last two months and more. This is an important break out.
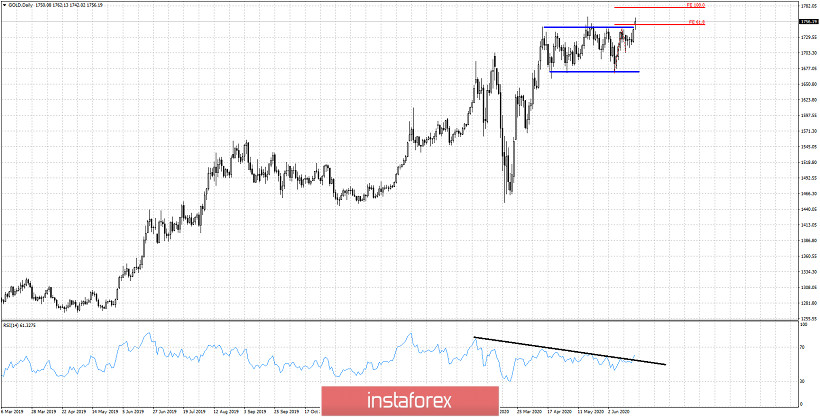
Blues lines - trading range
Black line -resistance trend line
Red lines - Fibonacci targets
The RSI is breaking above the resistance trend line. Price is making new highs. Price is showing bullish signs. There is also another bullish pattern in play here that traders should not ignore. An inverted bullish head and shoulders pattern.
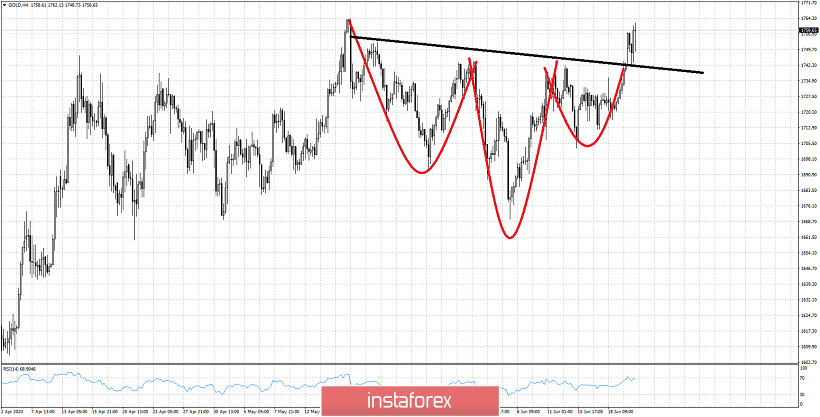
Red lines - Head and shoulders
Black line - neckline
Gold price is breaking above the neckline resistance. This is a bullish sign. As long as price is above we remain short-term bullish. Our head and shoulders pattern target is at $1,820.
Díky analytickým přehledům společnosti InstaForex získáte plné povědomi o tržních trendech! Jako zákazníkovi společnosti InstaForex je Vám k dispozici velký počet bezplatných služeb umožňujících efektivní obchodování.


