 Zůstat
Obchodní podmínky
Nástroje


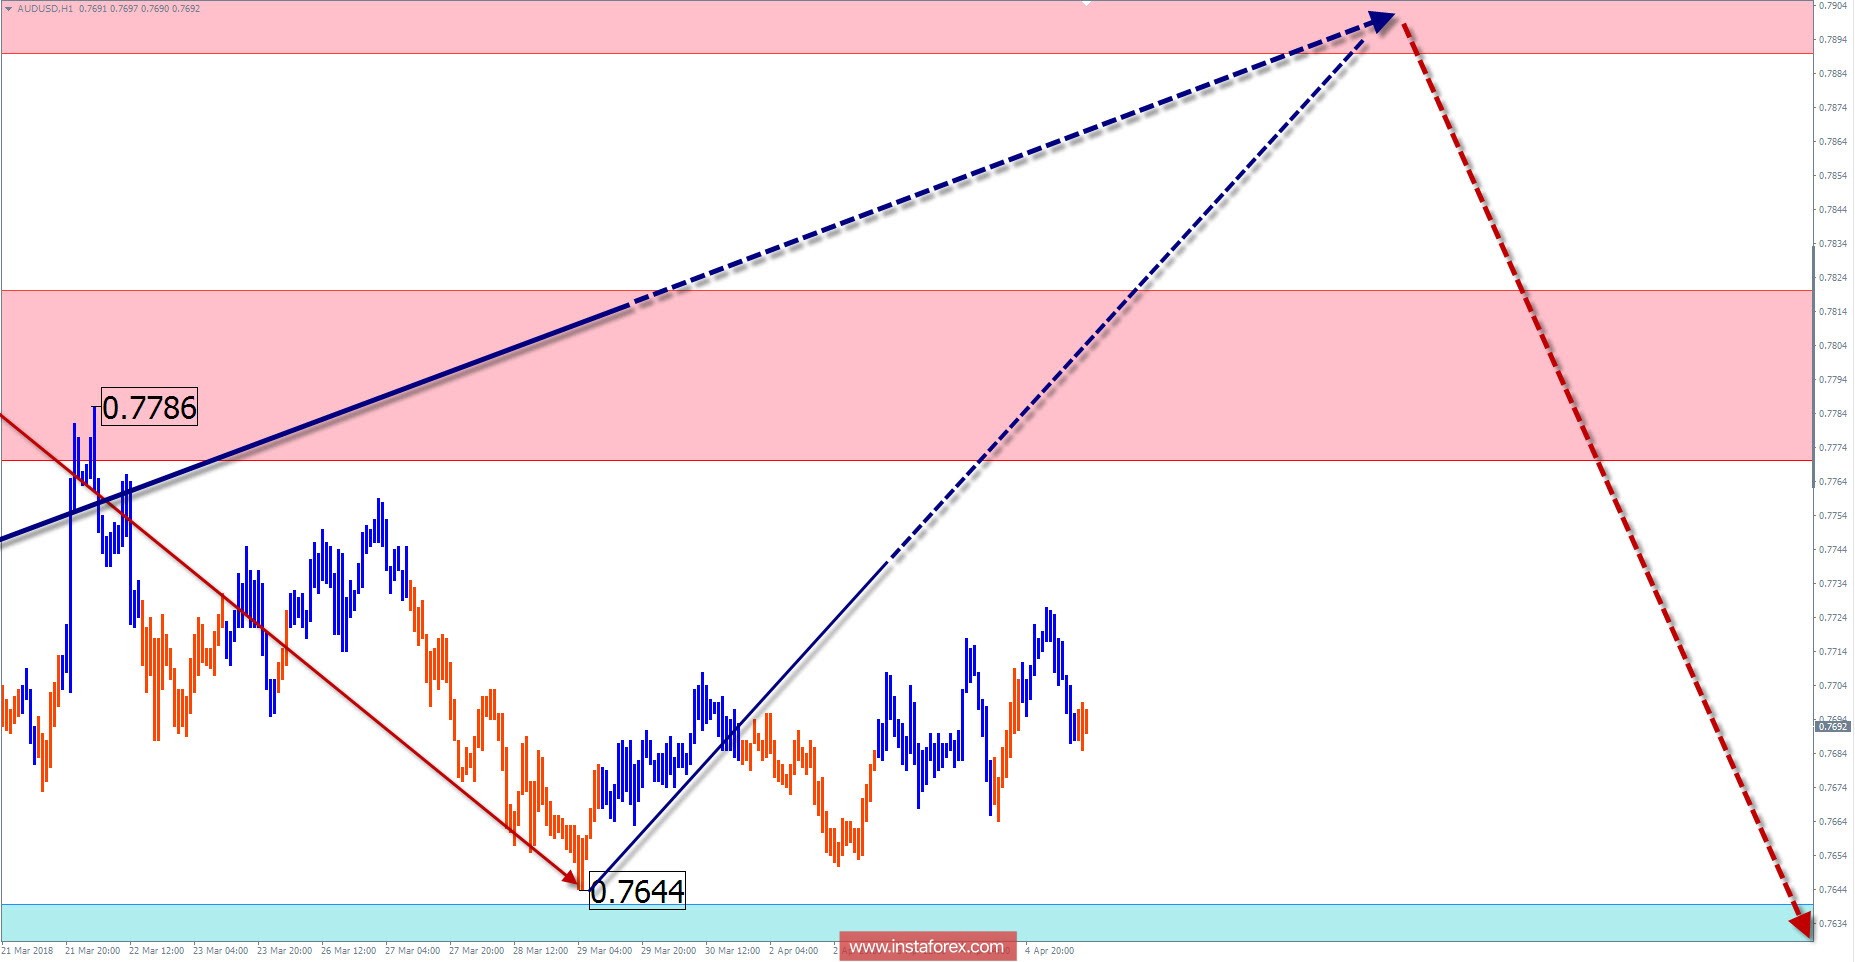
The rising wave of the instrument, which has dominated the chart since the beginning of 2016, has reached the boundaries of a strong reversal site of large scale. From its lower boundary since September of last year, a descending zigzag has begun to form. At this wave level, there is a high probability for the section of the chart to take the place of a correction.
The descending wave has by now formed the first 2 parts (A; B) as it begins working off the final phase (C). The likely completion levels of the rise are indicated by the boundaries of the calculated resistance zones.In turn, there is a need for correction within its framework, which can be expected in the coming days. The bearish wave will not occur without working off the continuation of the ascending part.
Boundaries of resistance zones:
- 0.7890 / 0.7940
- 0.7770 / 0.7820
Boundaries of support zones:
- 0.7640 / 0.7590
Explanations of the figures:
For simplified wave analysis, a simple waveform is used that combines 3 parts namely A, B, and C. All types of correction are created and most of the impulses can be found in these waves. Every time frame is considered and the last incomplete wave is analyzed.
The areas marked on the graphs indicate the probability of a change in the direction of motion has significantly increased as calculated in the areas. Arrows indicate the wave counting following the technique used by the author. A solid background of the arrows signifying the structure has been formed while the dotted one means the expected wave motion.
Attention: The wave algorithm does not take into account the duration of the movement of tools in time. The forecast is not a trading signal! To conduct a bargain, you need to confirm the signals used by your trading systems.
Díky analytickým přehledům společnosti InstaForex získáte plné povědomi o tržních trendech! Jako zákazníkovi společnosti InstaForex je Vám k dispozici velký počet bezplatných služeb umožňujících efektivní obchodování.

