 Zůstat
Obchodní podmínky
Nástroje


The most promising direction of the price movement of the major Swiss currency pair can be determined on the weekly scale of its schedule. After the collapse of the pair in January 2105, an upward wave of a large time frame has been formed. Analysis of the correction section (B) of the entire model indicates a high chance of its completion. Most likely, it is in the local low-end of February this year.
The upward movement, which has been formed in the last 2 months, has a high wave potential comparable to the entire preceding bearish wave. With a high degree of probability, this section is the first part of the reversal model, which prepares the conditions for changing the short-term direction of the trend.
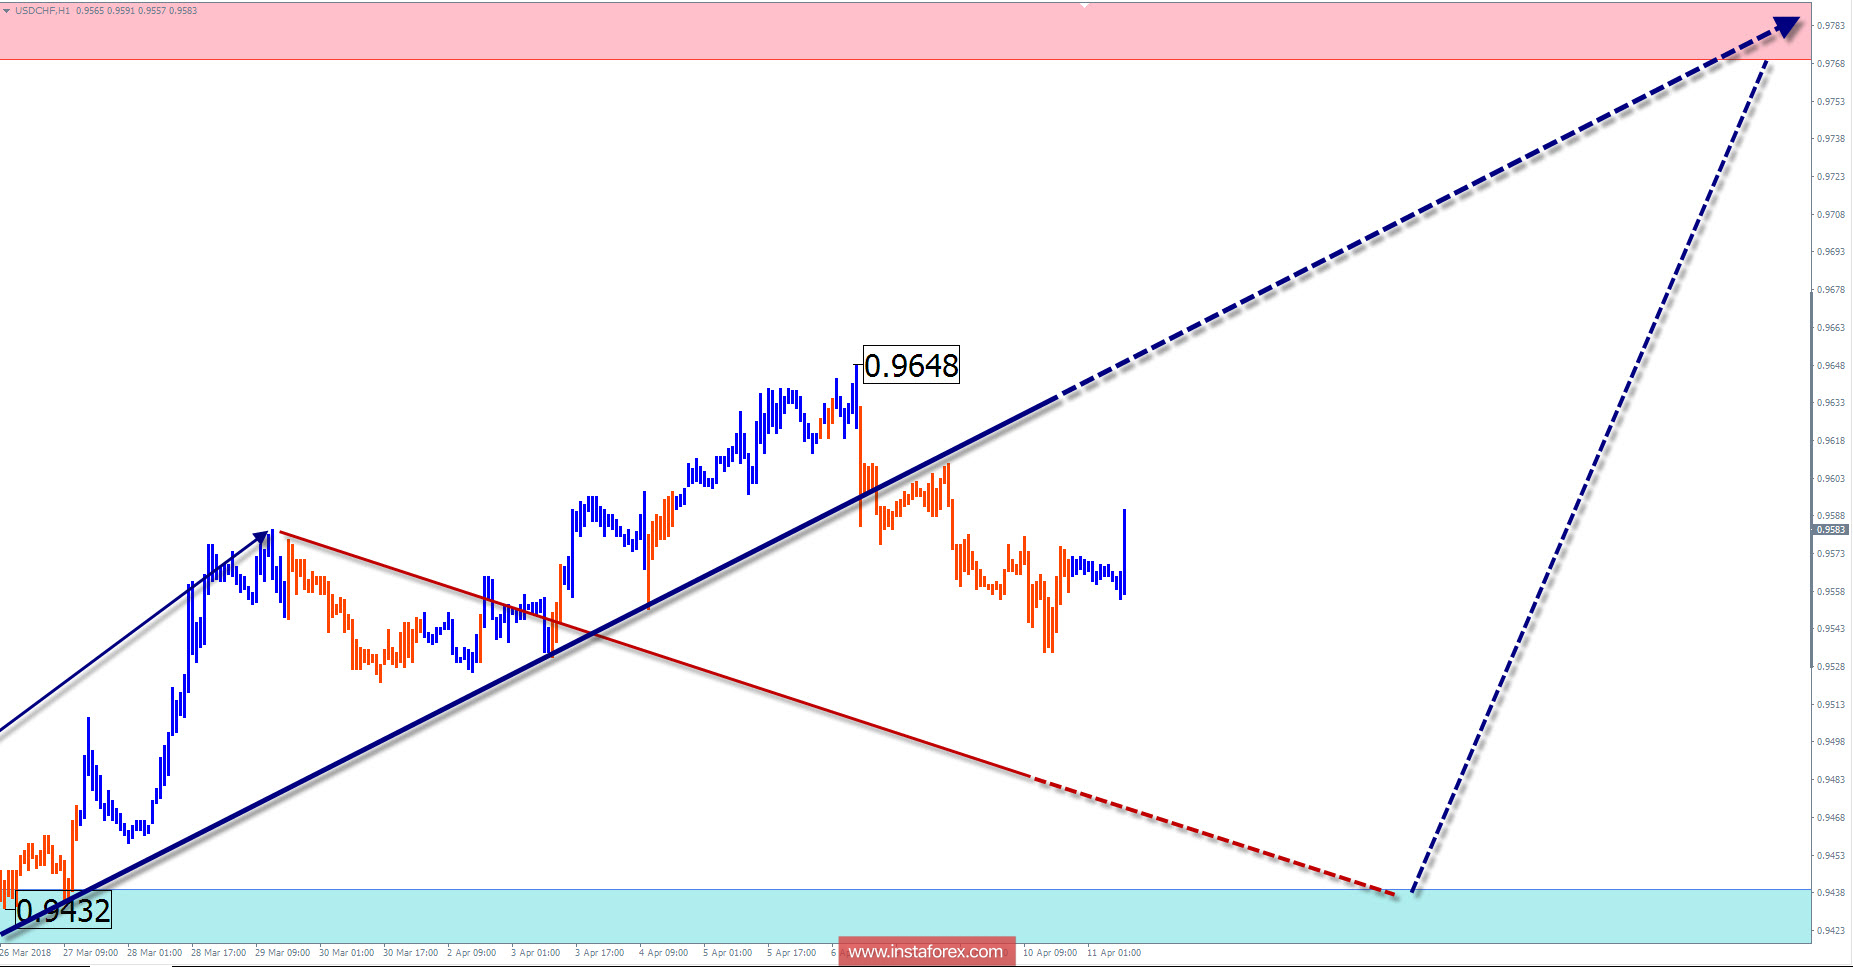
Until the end of the current trading week, you can wait for the phase of decline but not beyond the limits of settlement support. In the following days, the price growth is expected to resume, up to the control level of the potential reversal zone.
Boundaries of resistance zones:
- 0.9770 / 0.9820
Boundaries of support zones:
- 0.9440 / 0.9390
Explanations of the figures:
For simplified wave analysis, a simple waveform is used that combines 3 parts namely A, B, and C. All types of correction are created and most of the impulses can be found in these waves. Every time frame is considered and the last incomplete wave is analyzed.
The areas marked on the graphs indicate the probability of a change in the direction of motion has significantly increased as calculated in the areas. Arrows indicate the wave counting following the technique used by the author. A solid background of the arrows signifying the structure has been formed while the dotted one means the expected wave motion.
Attention: The wave algorithm does not take into account the duration of the movement of tools in time. The forecast is not a trading signal! To conduct a bargain, you need to confirm the signals used by your trading systems.
Díky analytickým přehledům společnosti InstaForex získáte plné povědomi o tržních trendech! Jako zákazníkovi společnosti InstaForex je Vám k dispozici velký počet bezplatných služeb umožňujících efektivní obchodování.

