 Zůstat
Obchodní podmínky
Nástroje


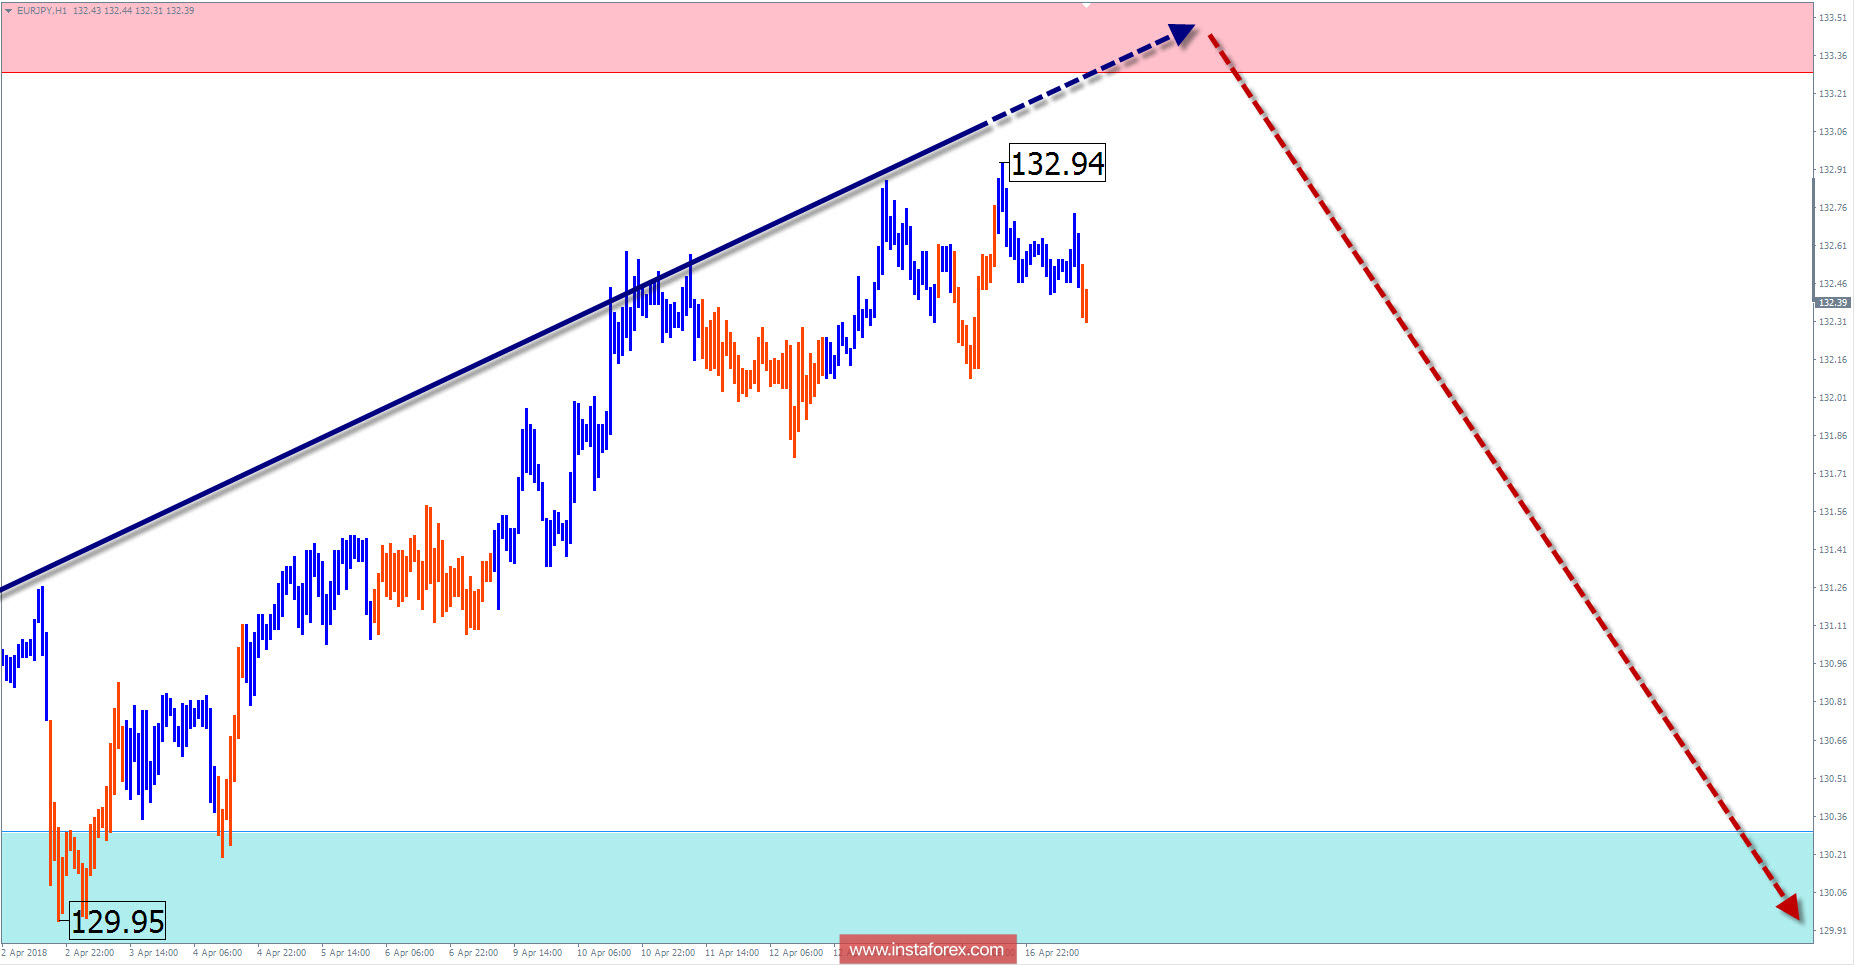
The two-year trend wave on the euro/yen cross-chart led the pair's price quotations to the levels three years ago. The structure of the entire wave is not yet completed.
The price reaches the lower boundary of the wide resistance zone stimulate the formation of the downward movement in the past two months. Considering the outset of the correction phase last September and showed an incorrect formation, the price reduction forms its final portion (C). The wave has formed a zigzag pattern. The middle, correcting phase has the form of an "expanding triangle".
Next week, the price movement will occur in the side channel. In the coming days, you can rely on price growth. The completion of the increase and reversal would likely occur in the resistance zone. Furthermore, a change of direction can be expected and a price reversal towards the beginning of the month.
Boundaries of resistance zones:
- 133.30 / 133.80
Boundaries of support zones:
- 130.30 / 129.80
Explanations to the figures: For simplified wave analysis, the simplest type of wave is used in the form of a zigzag, combining 3 parts (A; B; C). Of these waves, all kinds of correction are composed and most of the impulses. At each time frame, the last, incomplete wave is analyzed.
The areas marked on the graphs are indicated by the calculation areas, where the probability of a change in the direction of motion is significantly increased. Arrows indicate the wave counting according to the technique used by the author. The solid background of the arrows indicates the structure formed, the dotted one indicates the expected wave motion.
Attention: The wave algorithm does not take into account the duration of the tool movements in time. The forecast is not a trading signal! To conduct a trade transaction, you need to confirm the signals of your trading systems.
* The presented market analysis is informative and does not constitute a guide to the transaction.
Díky analytickým přehledům společnosti InstaForex získáte plné povědomi o tržních trendech! Jako zákazníkovi společnosti InstaForex je Vám k dispozici velký počet bezplatných služeb umožňujících efektivní obchodování.

