 Zůstat
Obchodní podmínky
Nástroje


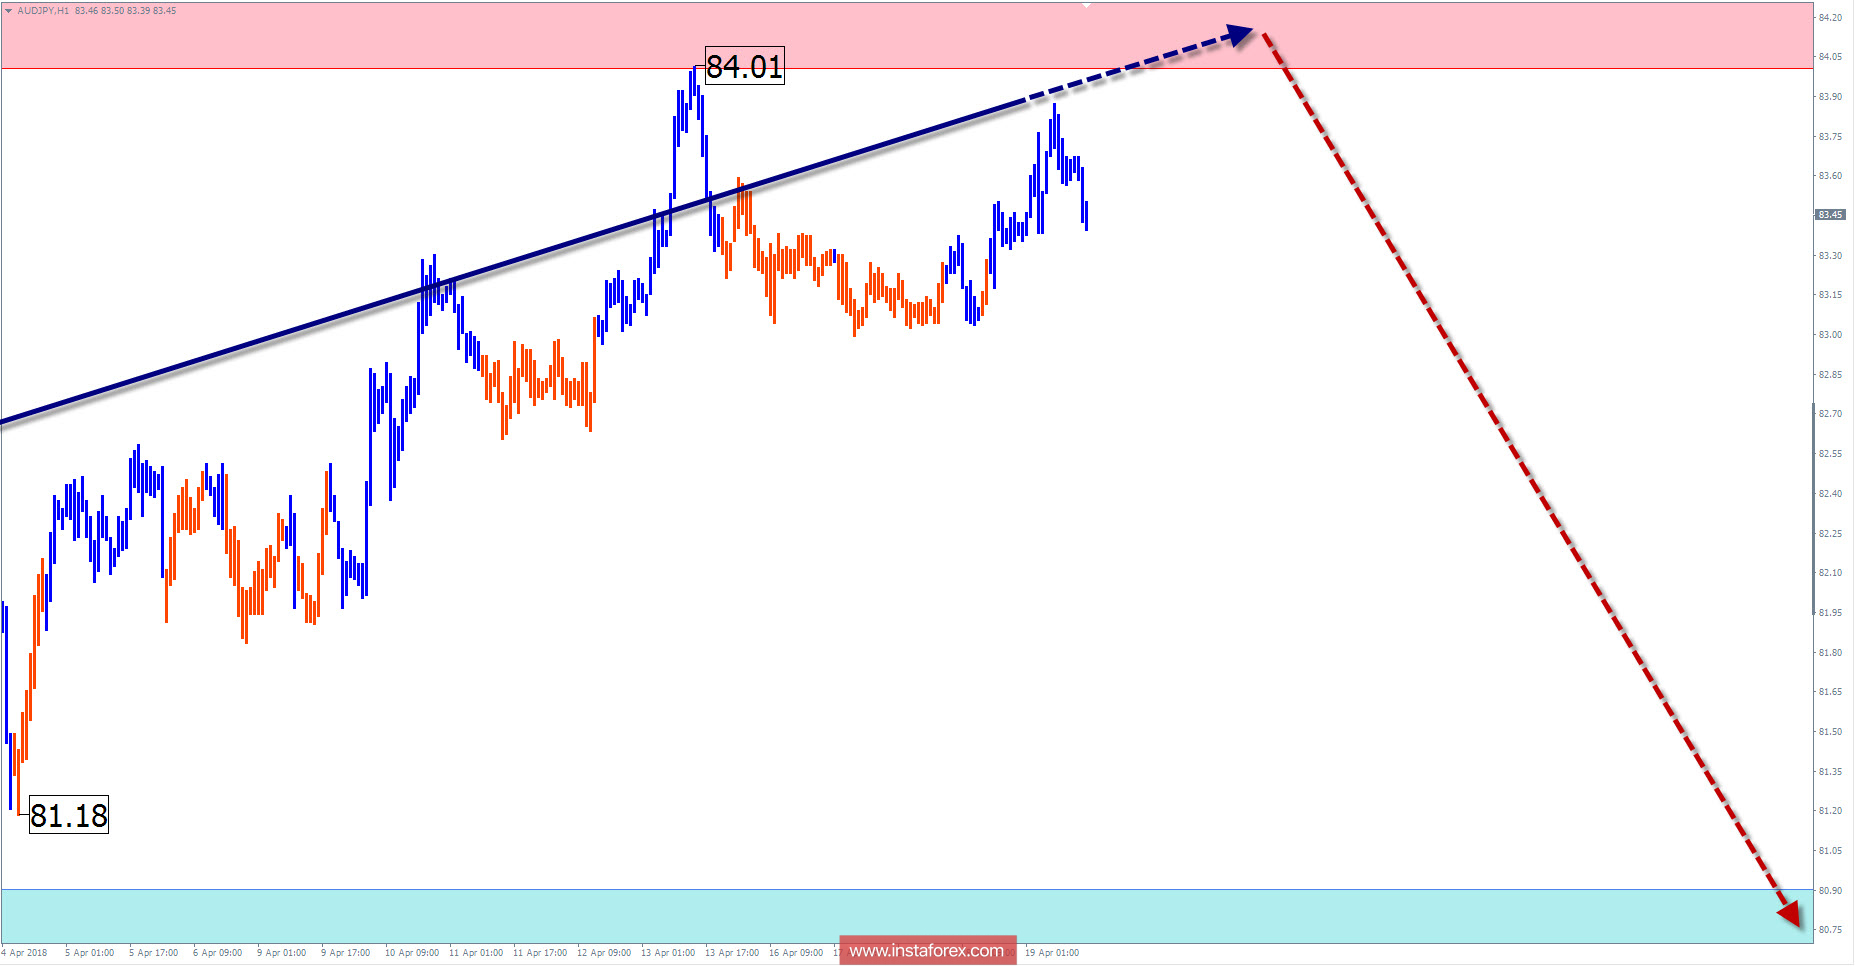
Quotes of the cross pair "Aussie" against the Japanese yen continue to form an upward wave of the large scale. After working off the first part since September last year, the counter corrective phase of the movement (B) obtained its distinct zigzag formation.
By the end of last month, the price had reached the upper boundary of the wide opposite zone of the potential reversal which gave rise to an upward pullback. The upside potential is limited since the increasing wave level is small.
In the coming days, the completion of price growth can be expected. Change of direction is also expected within the boundary of the determined resistance. The bearish exchange rate trend is possible next week.Boundaries of resistance zones:
- 84.00 / 84.50
Boundaries of support zones:
- 80.90 / 80.40
Explanations to the figures: For simplified wave analysis, the simplest type of wave is used in the form of a zigzag, combining 3 parts (A; B; C). Of these waves, all kinds of correction are composed and most of the impulses. At each time frame, the last, incomplete wave is analyzed.
The areas marked on the graphs are indicated by the calculation areas, where the probability of a change in the direction of motion is significantly increased. Arrows indicate the wave counting according to the technique used by the author. The solid background of the arrows indicates the structure formed, the dotted one indicates the expected wave motion.
Attention: The wave algorithm does not take into account the duration of the tool movements in time. The forecast is not a trading signal! To conduct a trade transaction, you need to confirm the signals of your trading systems.
* The presented market analysis is informative and does not constitute a guide to the transaction.
Díky analytickým přehledům společnosti InstaForex získáte plné povědomi o tržních trendech! Jako zákazníkovi společnosti InstaForex je Vám k dispozici velký počet bezplatných služeb umožňujících efektivní obchodování.

