 Zůstat
Obchodní podmínky
Nástroje


Over the past two years, the main trend direction of the cross chart is set by the ascending wave. A clear zigzag ABC pattern was formed in its structure. The last part of the wave structure is not yet complete.
After reaching the price of the lower boundary of strong reversal zone, the price proceeds to correction. The preliminary estimate of the most probable completion zone shows the area of the 124th price figure. Considering the impulse character of the trend, it is impossible to exclude early completion of correction after reaching minimum extension levels.
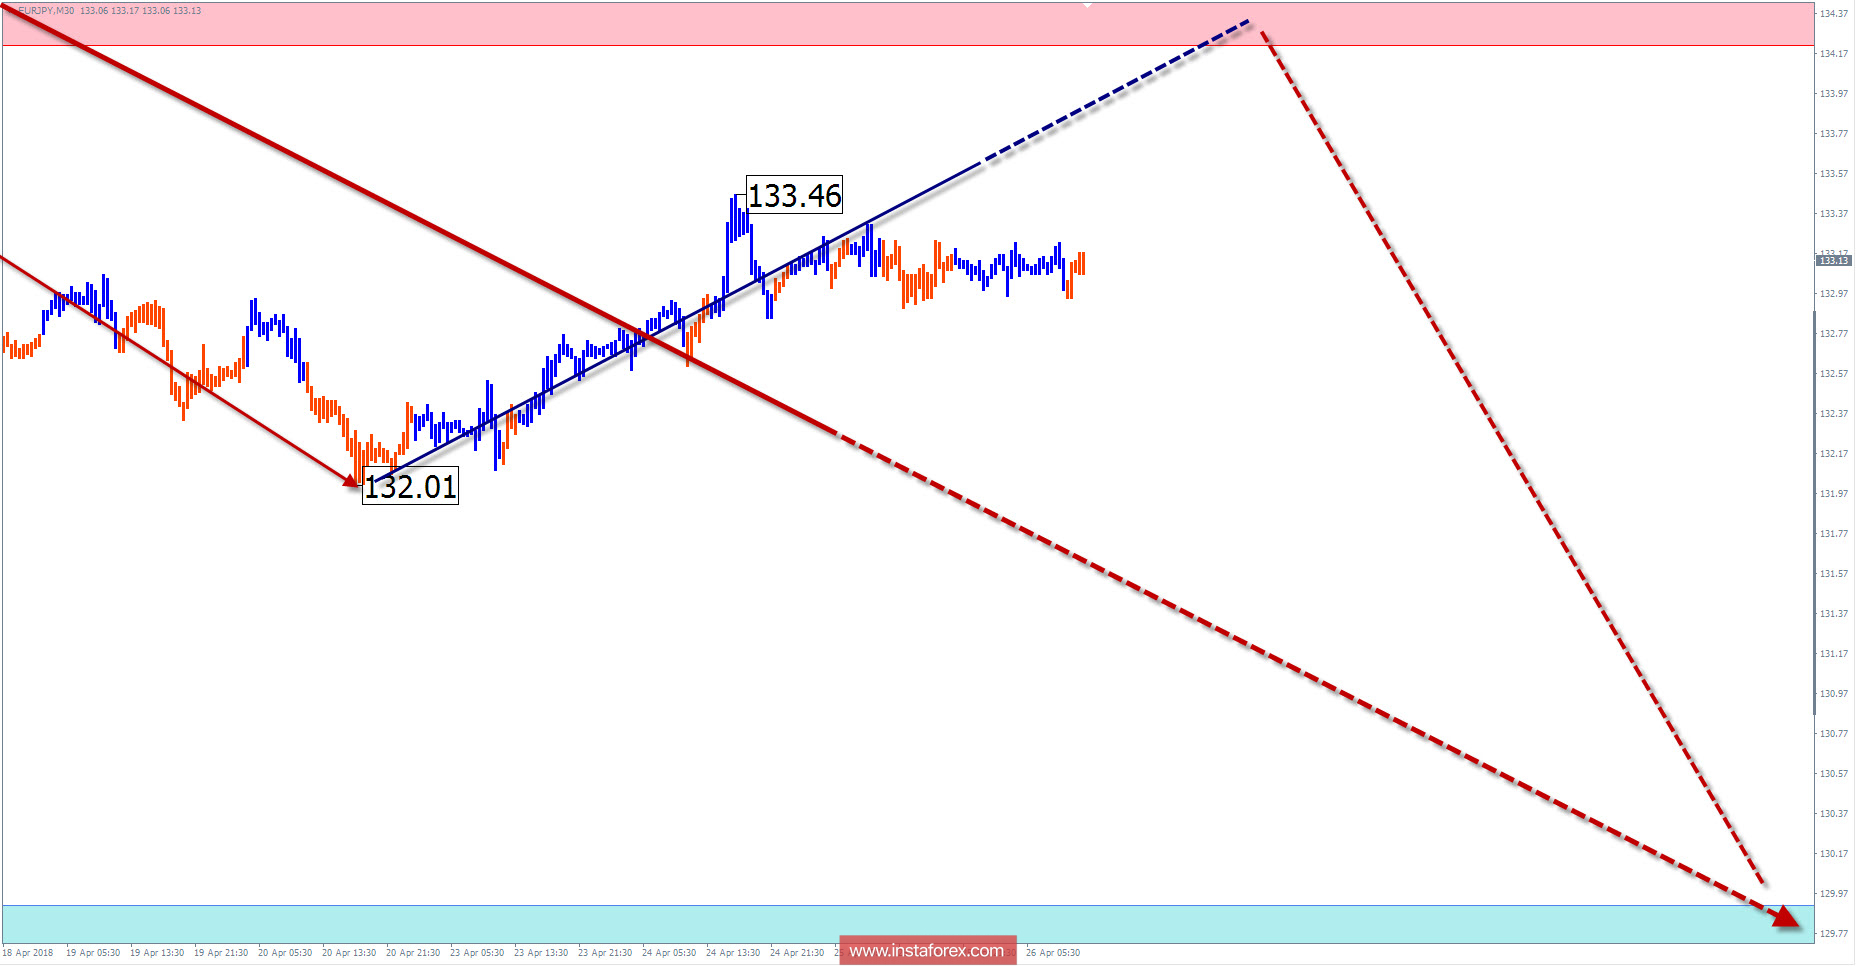
Today, the framework of the last incomplete descending section of February 2 shows that the price forms a bullish pullback. It is expected to be fully completed by the end of this month. Hence, there is a possibility for the direction to change, with a price reduction at least in the nearest support zone.
Boundaries of resistance zones:
- 134.20 / 134.70
Boundaries of support zones:
- 129.90 / 129.40
Explanations to the figures: For simplified wave analysis, the simplest type of wave is used in the form of a zigzag, combining 3 parts (A; B; C). Of these waves, all kinds of correction are composed and most of the impulses. At each time frame, the last, incomplete wave is analyzed.
The areas marked on the graphs are indicated by the calculation areas, where the probability of a change in the direction of motion is significantly increased. Arrows indicate the wave counting according to the technique used by the author. The solid background of the arrows indicates the structure formed, the dotted one indicates the expected wave motion.
Attention: The wave algorithm does not take into account the duration of the tool movements in time. The forecast is not a trading signal! To conduct a trade transaction, you need to confirm the signals of your trading systems.
* The presented market analysis is informative and does not constitute a guide to the transaction.
Díky analytickým přehledům společnosti InstaForex získáte plné povědomi o tržních trendech! Jako zákazníkovi společnosti InstaForex je Vám k dispozici velký počet bezplatných služeb umožňujících efektivní obchodování.


