 Zůstat
Obchodní podmínky
Nástroje


#CL
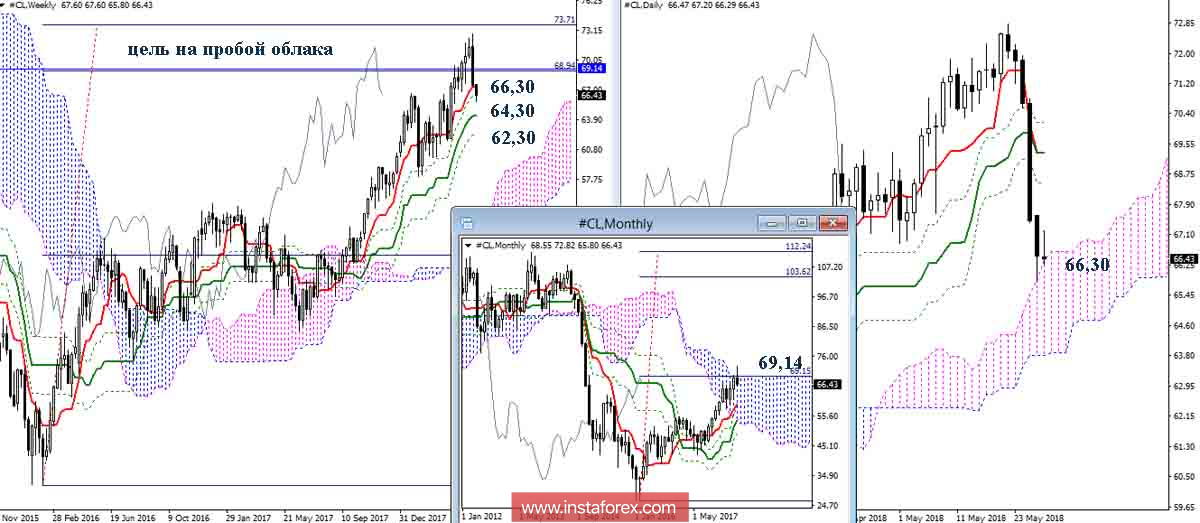
Analysis of the technical picture of oil allows you to note that this financial instrument has reached important targets the day before. The upward target for the breakdown of the weekly cloud (68.94 - 73.71) and the resistance of the upper boundary of the monthly cloud (69.14). The combination of these benchmarks is a significant milestone, as overcoming will not only allow us to talk about the strengthening of bullish sentiments, but will form a new large-scale upward reference point for the financial instrument, the goal of a monthly cloud breakdown. The significance of the possible goal is indicated by the fact that its performance is able to return oil to a price of 100-110 dollars per barrel. In the current situation, we observe that the strength of the resistance encountered provoked a corrective decline. Important support for maintaining the possible upside prospects now are the levels of the weekly cross and the daytime cloud (66.30 - 64.30 - 62.30). For players on the rise, it is desirable to limit the correction to these lines, since the elimination of the weekly gold cross and the breakdown of the day's cloud will contribute to the formation of downward benchmarks and will require a new assessment of the situation.
Indicator parameters:
All time intervals 9 - 26 - 52
The color of indicator lines:
Tenkan (short-term trend) - red,
Kijun (medium-term trend) - green,
Fibo Kijun is a green dotted line,
Chinkou is gray,
Clouds: Senkou Span B (SSB, long-term trend) - blue,
Senkou Span A (SSA) - pink.
The color of additional lines:
Support and resistance MN - blue, W1 - green, D1 - red, H4 - pink, H1 - gray,
Horizontal levels (not Ichimoku) - brown,
Trend lines - purple.
Díky analytickým přehledům společnosti InstaForex získáte plné povědomi o tržních trendech! Jako zákazníkovi společnosti InstaForex je Vám k dispozici velký počet bezplatných služeb umožňujících efektivní obchodování.


