 Zůstat
Obchodní podmínky
Nástroje


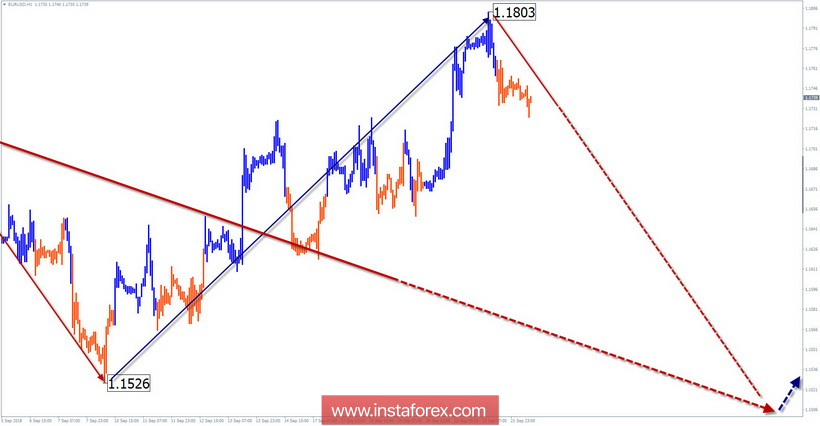
Wave pattern of the H4 chart:
The main direction of the trend since February this year moves the quotations of the euro major downwards. The price has reached a large-scale support zone.
Wave pattern of the H1 chart:
Since mid-August, the direction vector indicates an upward section. The first part of the wave zigzag of the older TF was formed. The price has reached the target zone.
Wave pattern of the M15 chart:
Since September 21, the price has moved down. A high wave level of decline allows you to wait for the continuation of the pair, up to the calculated zone.
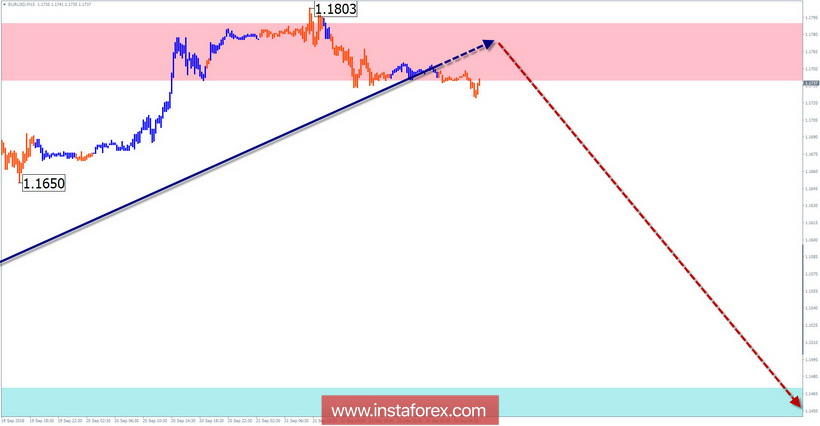
Recommended trading strategy:
Sales are associated with a high degree of uncertainty. The risk can be justified only in the intraday trading style. Market participants are encouraged to wait for the completion of the entire downward wave and then look for buy signals.
Resistance zone:
- 1.1740/1.1790
Support zone:
- 1.1470/1.1420
Explanation of figures: the simplified wave analysis uses waves consisting of 3 parts (A-B-C). For analysis, 3 main TFs are used, the last unfinished wave is analyzed on each one. Zones show the calculated areas with the highest probability of a reversal.
Arrows indicate wave marking according to the method used by the author. With a solid background showing a structure for determining the expected movement.
Note: the wave algorithm does not take into account the duration of the tool movements over time. To conduct a trade, you need to confirm the signals of the trading systems you use!
Díky analytickým přehledům společnosti InstaForex získáte plné povědomi o tržních trendech! Jako zákazníkovi společnosti InstaForex je Vám k dispozici velký počet bezplatných služeb umožňujících efektivní obchodování.

