 Zůstat
Obchodní podmínky
Nástroje


Large scale graphics:
Since February of this year, the wave of the main trend is moving down. However, the recoil less potential of the movement has been exhausted. From powerful support towards the opposite structure is formed, there's at least a correction.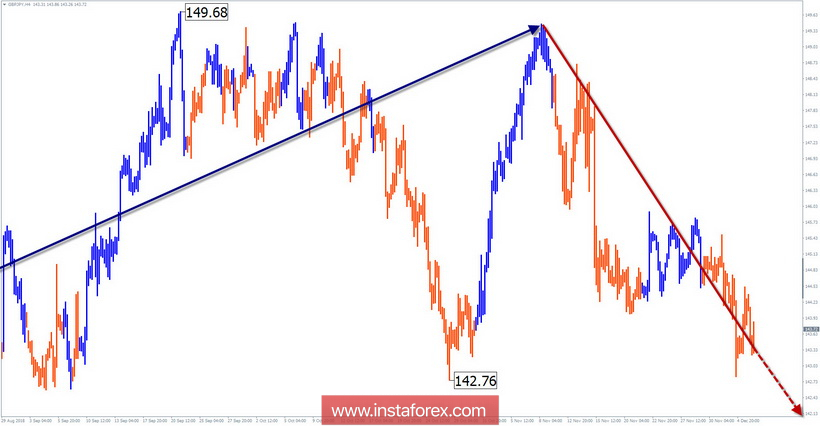
Medium scale graphics:
A month ago, the bear wave started actively. The high wave level of this movement indicates a high probability of the beginning of a new section of the main trend. In recent weeks, a flat correction is developing along the upper border of the powerful support level.
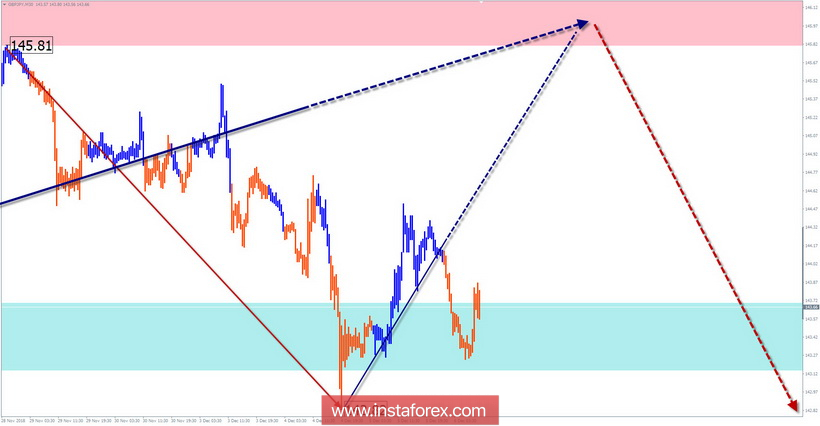
Small scale graphics:
The rising wave from November 15 develops in the form of a shifting plane. The structure lacks the final part (C).
Forecast and recommendations:
Shopping can be quite risky. The probability of a change in the direction of the short-term trend in the coming weeks is high. It is recommended to track signals selling cross.
Resistance zones:
- 145.80 / 146.30
Support areas:
- 143.70 / 143.20
Explanations to the figures: The simplified wave analysis uses waves consisting of 3 parts (A - B - C) . For analysis, 3 consecutive graphs are used. Each of them analyzes the last incomplete wave. Zones show calculated areas with the highest probability of reversal. While the arrows indicate the wave marking by the method used by the author. Lastly, the solid background shows the formed structure, the dotted - the expected movement.
Attention: The wave algorithm does not take into account the duration of tool movements over time. To conduct a trade transaction, you need confirmation signals from the trading systems you use.
Díky analytickým přehledům společnosti InstaForex získáte plné povědomi o tržních trendech! Jako zákazníkovi společnosti InstaForex je Vám k dispozici velký počet bezplatných služeb umožňujících efektivní obchodování.


