 Zůstat
Obchodní podmínky
Nástroje


Since April of this year, the main trend of the British pound is directed to the "south" of the price chart. The last TF waveform H4 has formed a flat correction (B) in the structure.
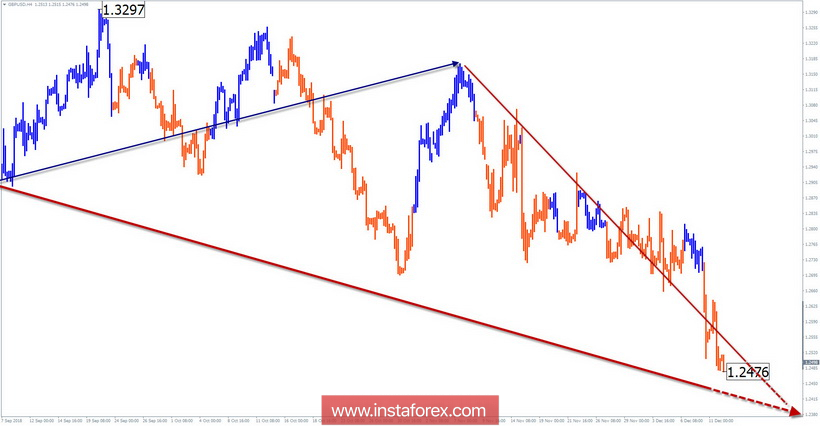
Medium scale graphics:
The decline that began on November 7 has a high potential and will eventually move to a higher wave level. Considering that in the wave of the daily trend, this section gave rise to the final part (C), the movement has a pronounced impulsive character.
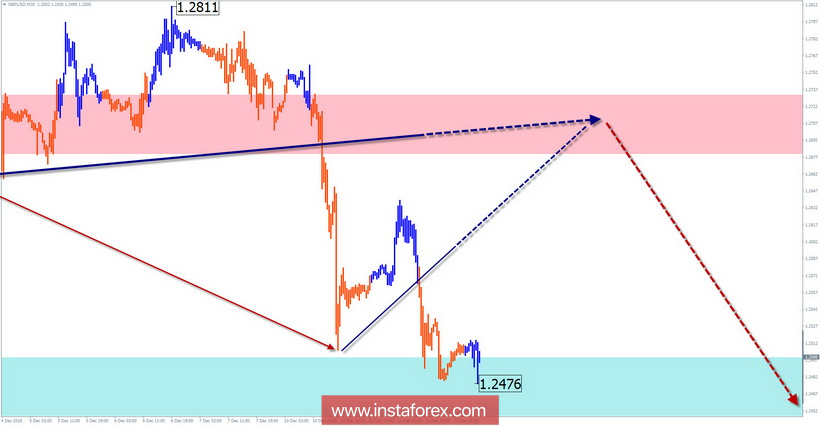
Small scale graphics:
From the middle of November, a bullish wave of the wrong kind is forming within the framework of the main time wave. The structure lacks a final lift (C). The price is within the strong support of a large TF.
Forecast and recommendations:
The decline that has begun coincides with the direction of the main trend, so it's more reasonable to ignore all movements towards it. In the area of the calculated resistance, it is recommended to track the sales signals of the instrument.
Resistance zones:
- 1.2680 / 1.2730
Support areas:
- 1.2500 / 1.2450
The simplified wave analysis uses waves consisting of 3 parts (A - B - C) . For analysis, 3 consecutive graphs are used. Each of them analyzes the last, incomplete wave. Zones show calculated areas with the highest probability of reversal. The arrows indicate the wave marking by the method used by the author. The solid background shows the formed structure, the dotted - the expected movement.
Attention:
Díky analytickým přehledům společnosti InstaForex získáte plné povědomi o tržních trendech! Jako zákazníkovi společnosti InstaForex je Vám k dispozici velký počet bezplatných služeb umožňujících efektivní obchodování.

