 Zůstat
Obchodní podmínky
Nástroje


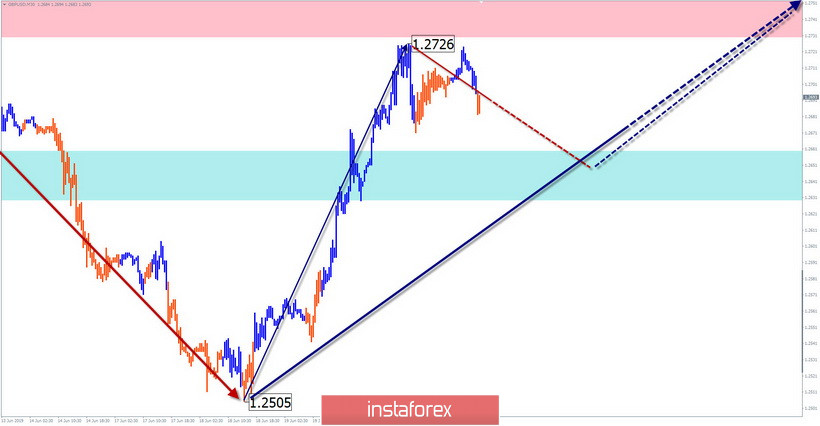
GBP / USD pair
Since the beginning of the year, the British pound dominates the bearish trend on the chart. From the strong support zone of large scale from June 18, a bullish wave is formed. The potential of which is sufficient to continue the begun movement at a higher level. Since yesterday, a correctional zigzag has been forming within this wave.
Forecast:
A descending vector is expected today in the morning. Right up to the completion of the entire downward price movement, then you can count on the turn and the beginning of the price rise. When changing course, volatility can increase dramatically.
Recommendations:
When selling pounds today, you should reduce the lot and be ready for sharp pullbacks. When the price reaches the support zone, it is recommended to track long entry signals.
Resistance zones:
- 1.2730 / 1.2760
Support areas:
- 1.2660 / 1.2630
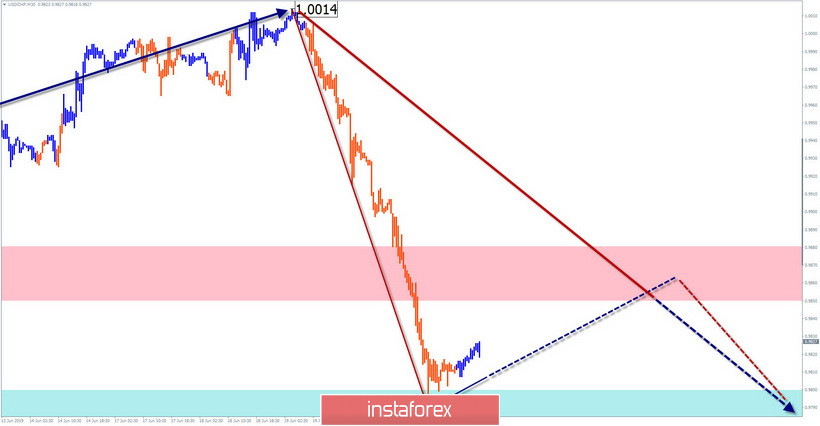
USD / CHF pair
On the chart of the Swiss franc, the formation of the bearish trend continues, starting from April 24th. The structure of the wave completed the first 2 parts (A + B). Since June 19, the final part (C) has been developed, which has a pronounced pulsed form. The upper boundary of the target zone is located approximately in the price figure from the current rate. Since yesterday, the price rolls back upward.
Forecast:
The overall flat mood of the franc price movements is expected today. In the morning, the price will mainly move upward. Rise beyond the boundaries of resistance is unlikely. By the end of the day, the chance of a reversal and a return to the trend rate increases.
Recommendations:
Purchases of the pair are possible today only within the framework of trading sessions with a minimum lot. It is necessary to consider the high probability of counter kickbacks.
At the end of the price rise, it is recommended to track the sale signals of the instrument.
Resistance zones:
- 0.9850 / 0.9880
Support areas:
- 0.9800 / 0.9770
Explanations to the figures: The simplified wave analysis uses waves consisting of 3 parts (A – B – C). Each of these analyzes the last incomplete wave. Zones show calculated areas with the highest probability of reversal. The arrows indicate the wave marking by the method used by the author. The solid background shows the formed structure and the dotted exhibits the expected movement.
Note: The wave algorithm does not take into account the duration of tool movements over time.
Díky analytickým přehledům společnosti InstaForex získáte plné povědomi o tržních trendech! Jako zákazníkovi společnosti InstaForex je Vám k dispozici velký počet bezplatných služeb umožňujících efektivní obchodování.


