 Zůstat
Obchodní podmínky
Nástroje


AUD / USD pair
As we expected in the previous review on the Australian dollar, the currency pair continues to consolidate in a complex lateral correction. On Wednesday, the fall in prices stopped on the line of the price channel on the daily chart, after which, the price went above the Fibonacci level of 23.6% this morning. The Marlin oscillator in a growing position and it is possible to continue the growth to the level of correction of 38.2% at 0.6832, coinciding with the low of June 18.
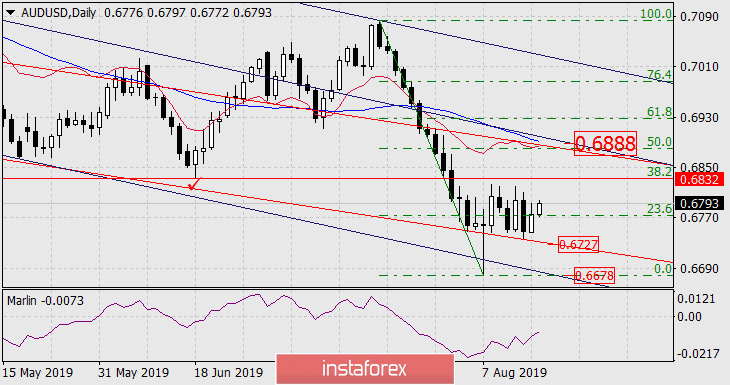
Multivariance is retained. Growth to the first target level can occur immediately, there may be another decrease from the current levels to the MACD line on the four-hour chart. Near this level, there is a support range of 0.6727/37. Again, this corresponds to the support on the older scale. Also, there can be two scenarios from 0.68332, either a further growth or spread, and spread of unpredictable depth. Extreme growth to the strong point of resistance at 0.6888, where two lines of price channels and the MACD line on daily converge, is not cleared.
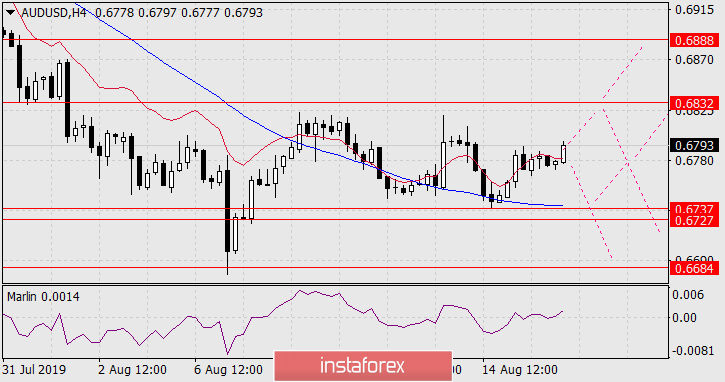
We are waiting for the development of events. At the moment, the price is higher than the red balance indicator line on the H4 chart. The Marlin oscillator is in the growth zone, which confirms the prospect of a moderate daily growth rate to the Fibonacci level of 38.2%.
Díky analytickým přehledům společnosti InstaForex získáte plné povědomi o tržních trendech! Jako zákazníkovi společnosti InstaForex je Vám k dispozici velký počet bezplatných služeb umožňujících efektivní obchodování.


