 Zůstat
Obchodní podmínky
Nástroje

Trend analysis.
This week, the price will move down with the first target of 1.1983 – the lower fractal (blue dotted line) and the final target of 1.1735 – the support line (blue bold line).
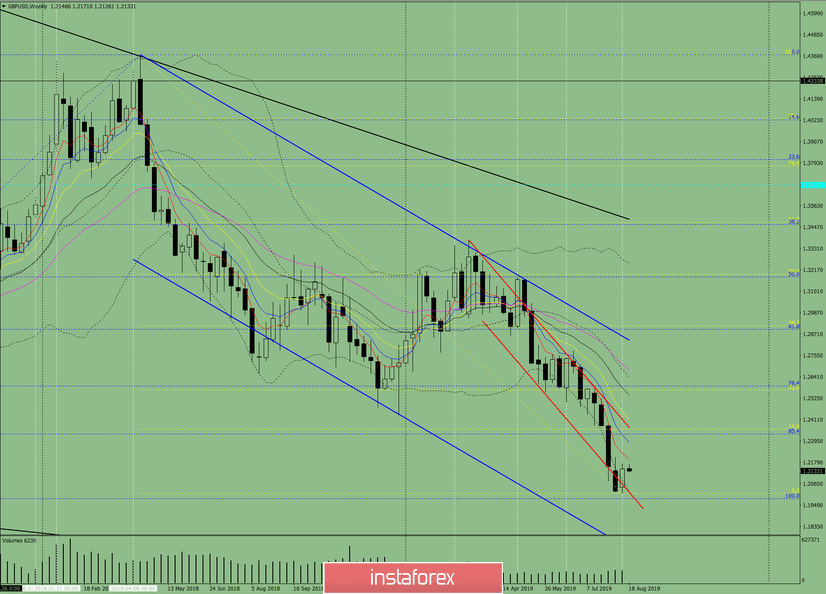
Fig. 1 (weekly chart).
Complex analysis:
- Indicator analysis – down;
- Fibonacci levels – down;
- Volumes – down;
-Candle analysis – up;
- Trend analysis – down;
- Bollinger bands – down;
- Monthly schedule – down.
The conclusion from the complex analysis is the downward movement.
The overall result of the calculation of the GBP/ USD candle on the weekly chart: the price in the week is likely to have a downward trend with the presence of the first upper shadow of the weekly black candle (Monday – up) and the absence of the second lower shadow (Friday – down).
This week, the price will move down from the first target of 1.1983 – the lower fractal (blue dotted line).
Díky analytickým přehledům společnosti InstaForex získáte plné povědomi o tržních trendech! Jako zákazníkovi společnosti InstaForex je Vám k dispozici velký počet bezplatných služeb umožňujících efektivní obchodování.


