 Zůstat
Obchodní podmínky
Nástroje

Trend analysis.
This week, the price will try moving down again to overcome the price level of 161.8% - 1.0919 (yellow dotted line).
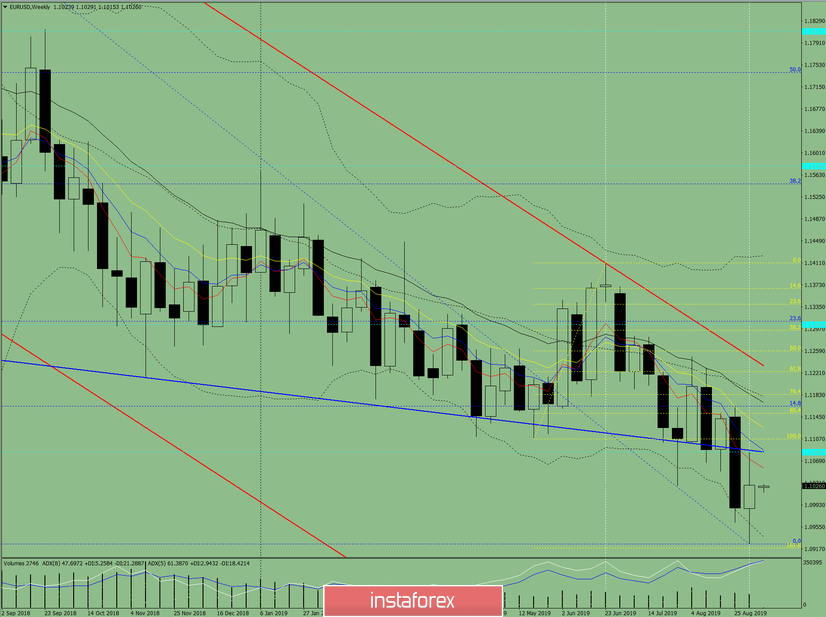
Fig. 1 (weekly schedule).
Comprehensive analysis:
- Indicator analysis – down;
- Fibonacci levels – down;
- Volumes – up;
- Candlestick analysis – neutral;
- Trend analysis – down;
- Bollinger Bands – up;
- Monthly chart – up.
The conclusion of the comprehensive analysis is a downward movement.
The overall result of calculating the candle of the EUR / USD currency pair according to the weekly chart: the price of the week is likely to have a downward trend with the absence of the first upper shadow of the weekly black candlestick (Monday – down) and the absence of the second lower shadow (Friday – down).
Díky analytickým přehledům společnosti InstaForex získáte plné povědomi o tržních trendech! Jako zákazníkovi společnosti InstaForex je Vám k dispozici velký počet bezplatných služeb umožňujících efektivní obchodování.


