 Zůstat
Obchodní podmínky
Nástroje

Trend analysis.
This week, the price will once again try to overcome the resistance line of 1.1076 (blue bold line).
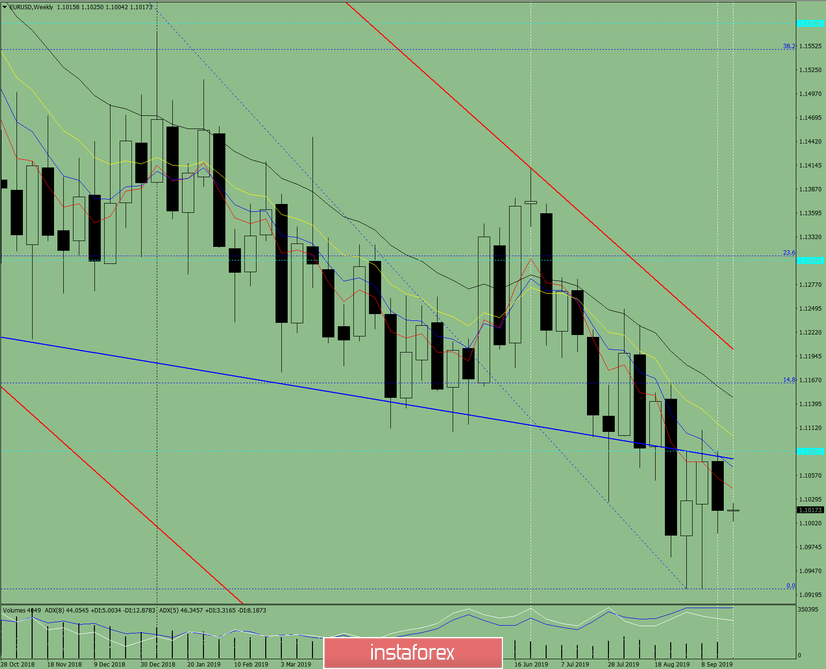
Fig. 1 (weekly chart).
Complex analysis:
- Indicator analysis – up;
- Fibonacci levels – up;
- Volumes – up;
- Candlestick analysis – neutral;
- Trend analysis – down;
- Bollinger bands – down;
- Monthly chart – up.
The conclusion of the complex analysis is an upward movement.
The overall result of calculating the candle of the EUR/USD currency pair according to the weekly chart: the price of the week is likely to have an upward trend with the absence of the first lower shadow of the weekly white candlestick (Monday – up) and the absence of the second upper shadow (Friday – up).
Díky analytickým přehledům společnosti InstaForex získáte plné povědomi o tržních trendech! Jako zákazníkovi společnosti InstaForex je Vám k dispozici velký počet bezplatných služeb umožňujících efektivní obchodování.


