 Zůstat
Obchodní podmínky
Nástroje

Trend analysis (Fig. 1).
On Friday, the market may attempt to break the resistance line 1.1031 (blue bold line) once again. If successful, it will rush to the goal 1.1056 - a pullback level of 76.4% (blue dashed line).
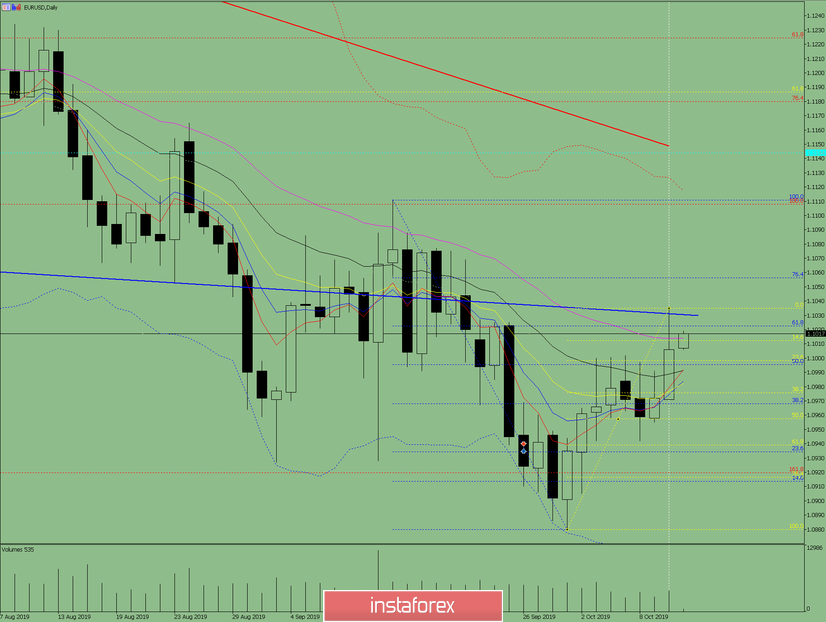
Fig. 1 (daily chart).
Comprehensive analysis:
- indicator analysis - up;
- Fibonacci levels - up;
- volumes - up;
- candlestick analysis - the top;
- trend analysis - up;
- Bollinger Lines - up;
- weekly schedule - up.
General conclusion:
On Friday, an upward movement is possible.
The upper target of 1.1031 is the resistance line (blue bold line).
From the level of 1.1031, you can work down with the target of 1.0998 - a pullback level of 23.6% (yellow dashed line).
An unlikely scenario - from the level of 1.1031, moving up to the target of 1.1056 - a pullback level of 76.4% (blue dashed line).
Díky analytickým přehledům společnosti InstaForex získáte plné povědomi o tržních trendech! Jako zákazníkovi společnosti InstaForex je Vám k dispozici velký počet bezplatných služeb umožňujících efektivní obchodování.


