 Zůstat
Obchodní podmínky
Nástroje

Trend analysis.
This week, the price will move up with the first target of 1.3120 – resistance line (black bold line). In the case of achievement, it is possible to roll back down.
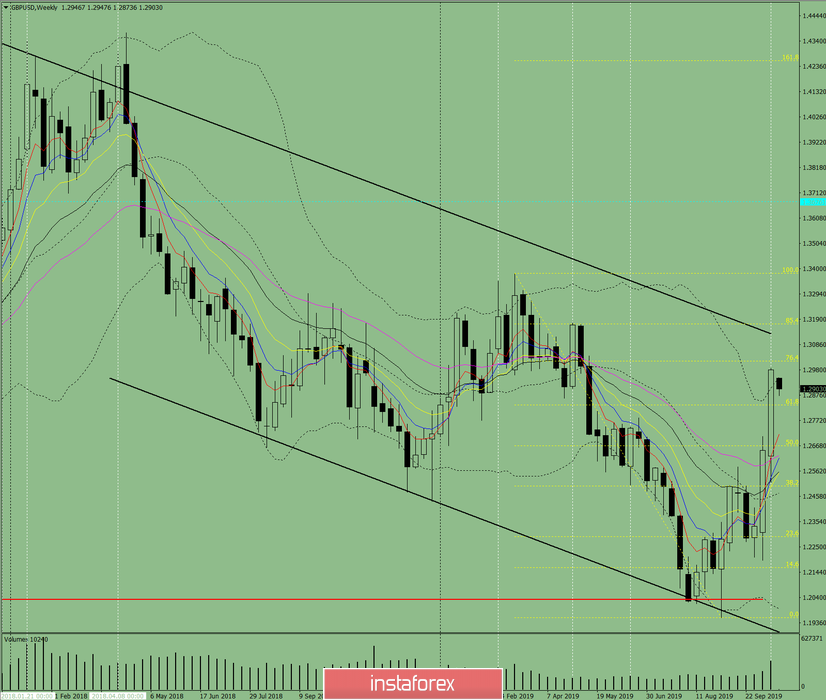
Fig. 1 (weekly chart).
Complex analysis:
- Indicator analysis – up;
- Fibonacci levels – up;
- Volumes – up;
- Candlestick analysis – down;
- Trend analysis – up;
- Bollinger Bands – up;
- Monthly chart – up.
The conclusion of the complex analysis – an upward movement.
The overall result of calculating the candle of the GBP/USD currency pair according to the weekly chart: the price for weeks is more likely to have an upward trend with the presence of the first lower shadow of the weekly white candlestick (Monday – down) and the absence of the second upper shadow (Friday – up).
The upper target of 1.3120 is the resistance line (black bold line), from which a downward rollback is possible.
Díky analytickým přehledům společnosti InstaForex získáte plné povědomi o tržních trendech! Jako zákazníkovi společnosti InstaForex je Vám k dispozici velký počet bezplatných služeb umožňujících efektivní obchodování.


