 Zůstat
Obchodní podmínky
Nástroje


Trend analysis.
This week, the price will move up with the first target of 1.3302 - resistance line (black bold line). If reached, work down from the target of 1.3108 - a pullback level of 14.6% (red dotted line).
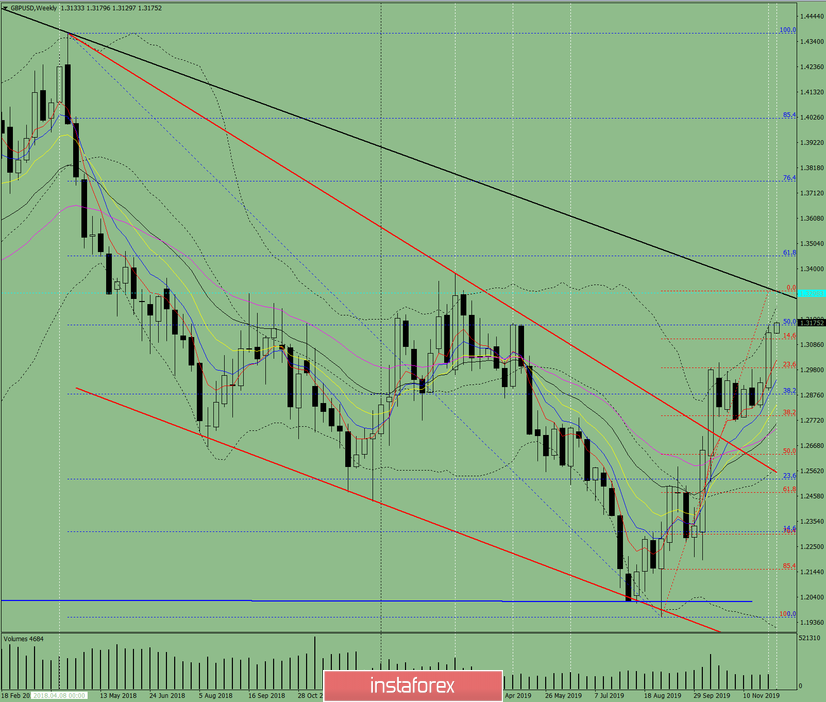
Fig. 1 (weekly chart).
Comprehensive analysis:
- Indicator analysis - up;
- Fibonacci levels - up;
- Volumes - down;
- Candle analysis - up;
- Trend analysis - up;
- Bollinger Bands - down;
- Monthly chart - up.
The conclusion of the complex analysis - an upward movement.
The total result of calculating the candle of the GBP/USD currency pair according to the weekly chart: the price of the week is likely to have an upward trend with the absence of the first lower shadow of the weekly white candlestick (Monday - up) and the presence of the second upper shadow (Friday - down).
The first upper target of 1.3302 is the resistance line (black bold line). If reached, work down from the target of 1.3108 - a pullback level of 14.6% (red dotted line).
An unlikely scenario - from the level of 1.3166, work down to the target of 1.2989 - a pullback level of 23.6% (red dotted line).
Díky analytickým přehledům společnosti InstaForex získáte plné povědomi o tržních trendech! Jako zákazníkovi společnosti InstaForex je Vám k dispozici velký počet bezplatných služeb umožňujících efektivní obchodování.

