 Zůstat
Obchodní podmínky
Nástroje


In December, the price moved up, broke through the resistance line of the downward channel of 1.3287 (black thick line) and reached the retracement level of 61.8% - 1.3451 (blue dotted line). After testing the pullback level of 61.8%, the pair went quite far down and closed below the resistance line of 1.3287.
Trend analysis.
In January, it is possible to move up with the target of 1.3514 - the upper fractal (red dotted line). If this level is overcome, the next top target is a pullback level of 76.4% - 1.3759 (blue dotted line).
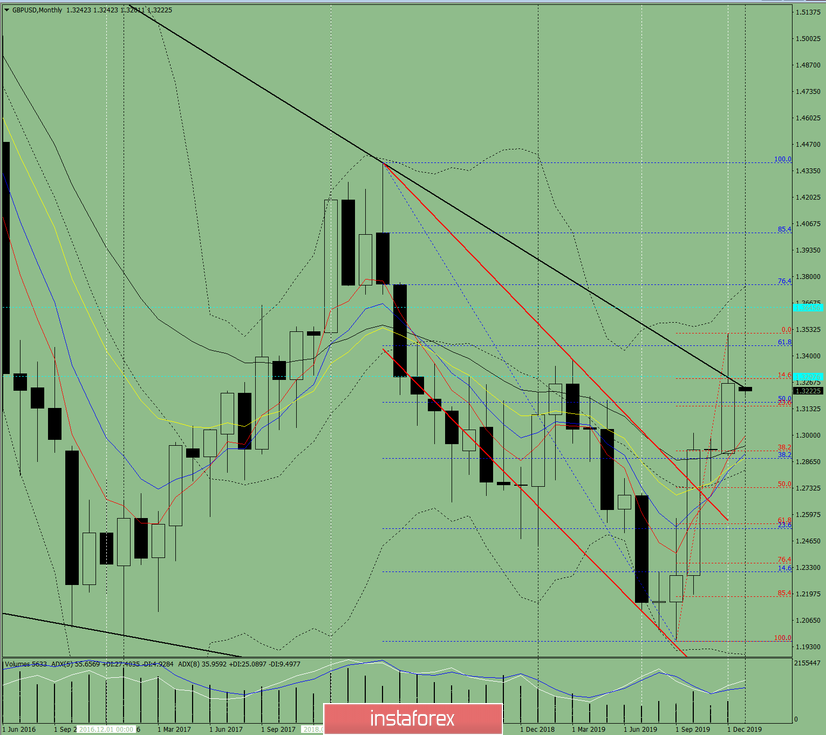
Fig. 1 (monthly chart).
Indicator analysis:
- Indicator analysis - up;
- Fibonacci levels - up;
- Volumes - up;
- Technical analysis - down;
- Trend analysis - up;
- Bollinger lines - up;
The conclusion on complex analysis - the upper hand is possible.
The overall result of calculating the candle of the GBP/USD currency pair according to the monthly chart: the price will most likely have an upward trend with the absence of the first lower shadow (first week of the month - white) and the absence of the second upper shadow (last week - white).
The upper target is 1.3514 - the upper fractal (red dotted line). If this level is overcome, the next top target is a pullback level of 76.4% - 1.3759 (blue dotted line).
An unlikely scenario - from the level of 1. 3235 resistance line (black bold line) downward movement with a target of 1.2919 - 38.2% pullback level (red dotted line).
Díky analytickým přehledům společnosti InstaForex získáte plné povědomi o tržních trendech! Jako zákazníkovi společnosti InstaForex je Vám k dispozici velký počet bezplatných služeb umožňujících efektivní obchodování.


