 Zůstat
Obchodní podmínky
Nástroje


Last week, the pair, having broken through the resistance line 1.2871 (white bold line), made an upward movement and then broke through the pullback level 23.6% - 1.3029 (red dashed line). Thus, the upward movement will most likely continue this week.
Trend analysis:
This week, the price is likely to continue to move upward, with the goal of reaching the resistance line - 1. 3170 (black bold line), and if this line is reached - pullback work down with the target 1.3003 - 13 average EMA (yellow thin line).
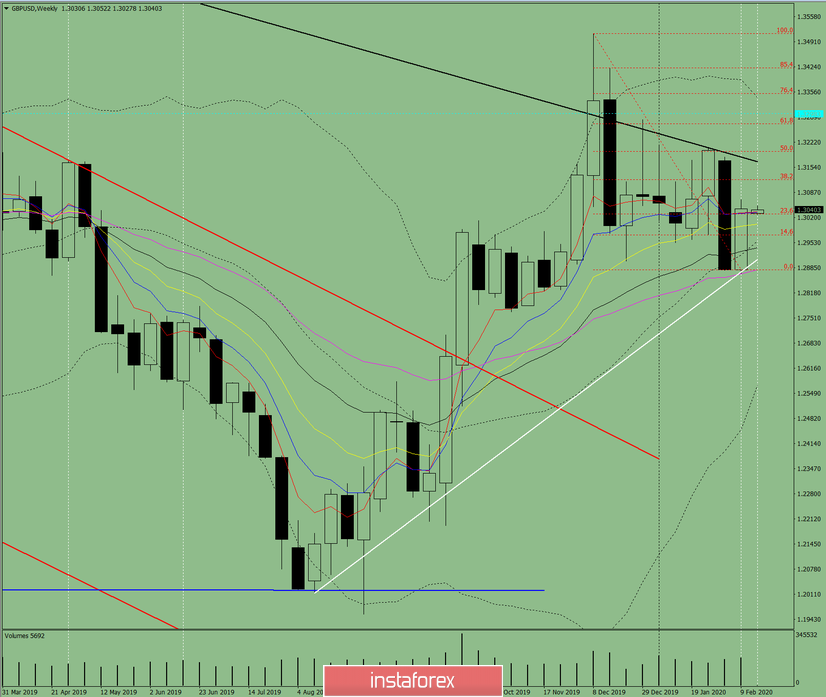
Fig. 1 (weekly schedule).
Comprehensive analysis:
- indicator analysis - up;
- Fibonacci levels - up;
- volumes - up;
- candlestick analysis - neutral;
- trend analysis - up;
- Bollinger Lines - down;
- monthly chart - down.
The conclusion of a comprehensive analysis is an upward movement.
The overall result of calculating the candle of the GBP / USD currency pair according to the weekly chart: the price of the week is likely to have an upward trend with the absence of the first lower shadow of the weekly white candlestick (Monday - up) and the presence of the second upper shadow (Friday - down).
The first upper target of 1. 3170 is the resistance line (black bold line).
An unlikely lower scenario: work down with the first target 1.2904 - support line (white bold line) from a pullback level of 23.6% - 1.3029 (red dashed line).
Díky analytickým přehledům společnosti InstaForex získáte plné povědomi o tržních trendech! Jako zákazníkovi společnosti InstaForex je Vám k dispozici velký počet bezplatných služeb umožňujících efektivní obchodování.

