 Zůstat
Obchodní podmínky
Nástroje

Trend analysis (Fig. 1).
Today, from the support level of 1.2903 (white bold line) a downward movement is possible with the first target of 1.2849 at the lower fractal (red dashed line). If this level is reached, there is a continuation of work down with the target of 1.2797, the lower border of the Bollinger line indicator (blue dashed line curve).
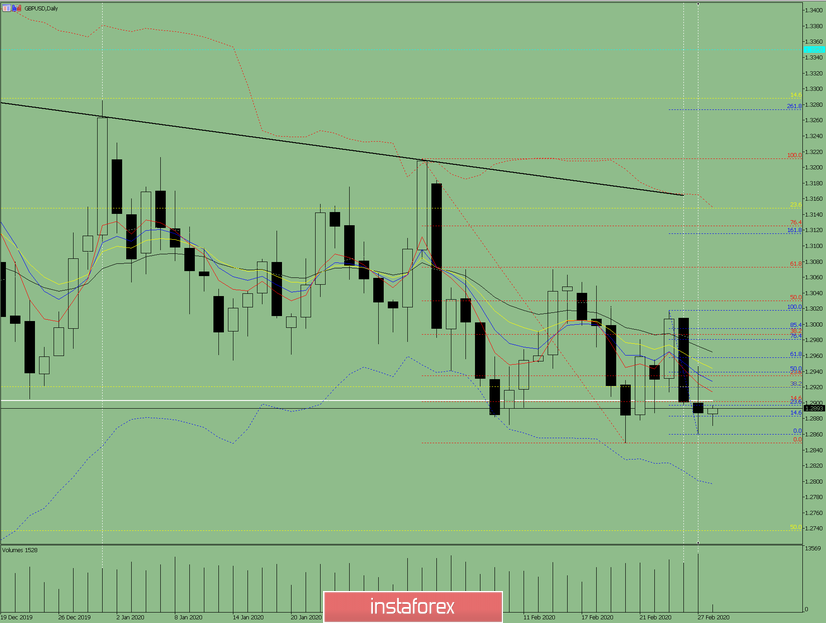
Fig. 1 (daily chart).
Comprehensive analysis:
- Indicator analysis - down;
- Fibonacci levels - down;
- Volumes - up;
- Candlestick analysis - neutral;
- Trend analysis - down;
- Bollinger lines - down;
- Weekly schedule - down.
General conclusion:
Today, the price may continue to move down.
An unlikely scenario is from the support level of 1.2903 (white bold line), an upward movement is possible with the target of 1.2939, the pullback level of 50% (blue dashed line).
Díky analytickým přehledům společnosti InstaForex získáte plné povědomi o tržních trendech! Jako zákazníkovi společnosti InstaForex je Vám k dispozici velký počet bezplatných služeb umožňujících efektivní obchodování.


