 Zůstat
Obchodní podmínky
Nástroje


In March, the price moved in the side channel with rather high volatility. First, the market tested the resistance line of the downward channel 1.1495 (red bold line), and then the support line 1.0674 (red bold line). After leaving the support line (red bold line), the pair went up quite strongly (by 396 points) in the last decade of the month.
Trend analysis:
In April, a downward movement is possible with the first target at 1.0885 - a pullback level of 38.2% (blue dashed line). In case of breaking this line down, continuing to the next target 1.0840 - a pullback level of 50.0% (blue dashed line) will be considered. If this rollback level is not broken through 50.0% - work up with the first target 1.1087 - pullback level of 23.6% (red dashed line).
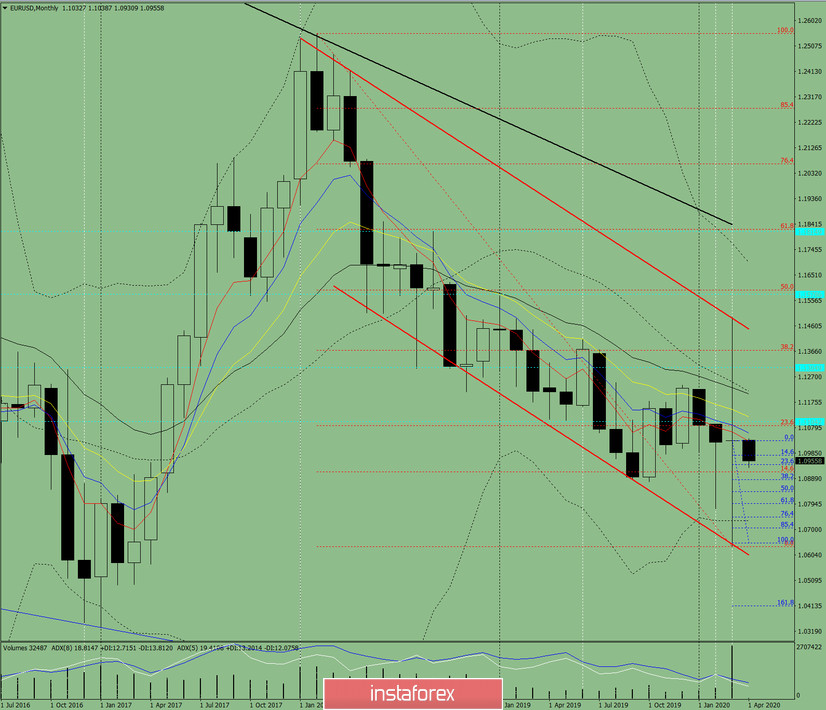
Fig. 1 (monthly chart).
Indicator Analysis:
- indicator analysis - down;
- Fibonacci levels - down;
- volumes - up;
- candlestick analysis - neutral;
- trend analysis - down;
- Bollinger lines - down;
The conclusion of a comprehensive analysis is most likely the bottom work.
The total result of calculating the candle of the EUR / USD currency pair according to the monthly chart: the price will most likely have a downward trend with the absence of the first upper shadow (the first week of the month is the lower one) for the monthly black candlestick and the presence of the second lower shadow (last week is white).
Lower scenario: from the level of 1.1032 (closing the March monthly candle), go to the first lower target of 1.0840 - a pullback level of 50.0% (blue dashed line). In case of breaking this line down, we will continue to the next target of 1.0796 - pullback level of 61.8% (blue dashed line).
Upper scenario: from the level of 1.1041 - the pullback level of 23.6% (blue dashed line), continue to the first upper target of 1.1087 - the pullback level of 23.6% (red dashed line).
Díky analytickým přehledům společnosti InstaForex získáte plné povědomi o tržních trendech! Jako zákazníkovi společnosti InstaForex je Vám k dispozici velký počet bezplatných služeb umožňujících efektivní obchodování.


