 Zůstat
Obchodní podmínky
Nástroje


To open long positions on EURUSD, you need:
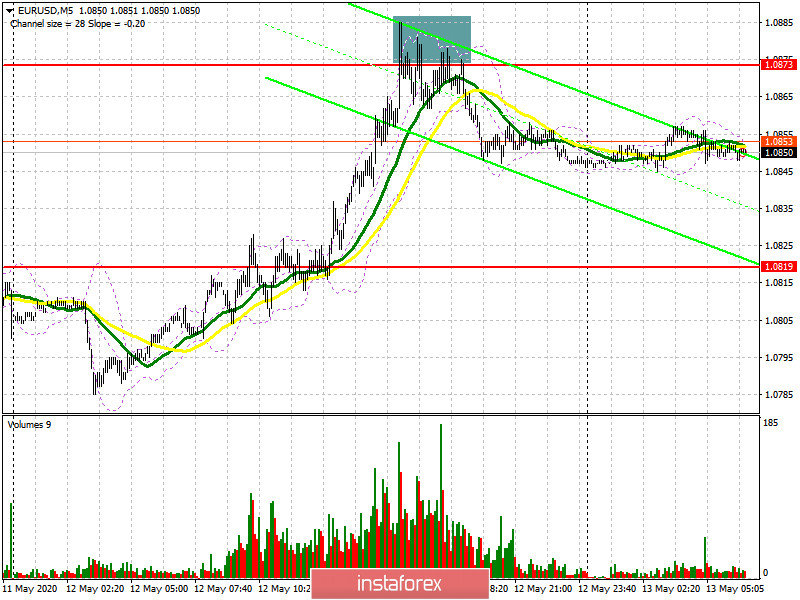
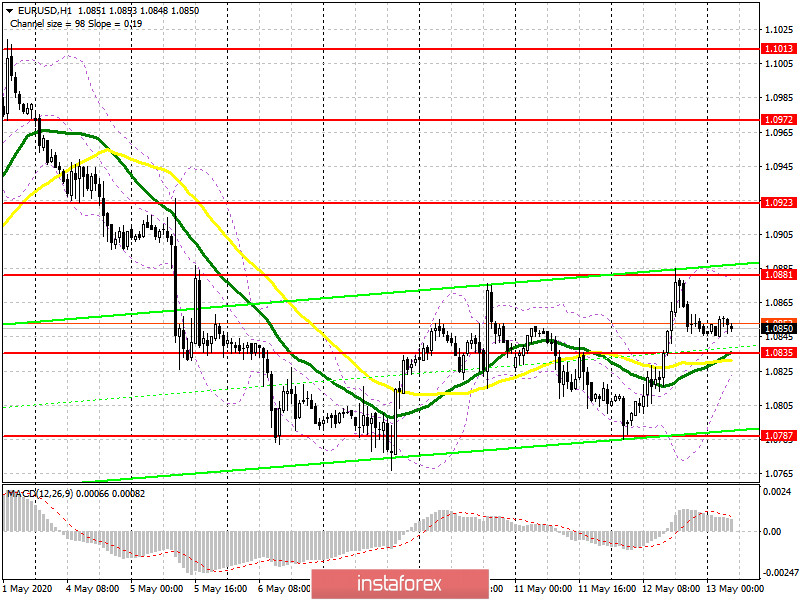
Yesterday's sharp rise in the euro after such weak fundamental data on the US economy was a surprise for me personally, but I have to measure reality. The market may be beginning to return to the right track and respond adequately to the data, which is worth paying attention to in the future. As for yesterday's deals, on the 5-minute chart, you can see sales from the resistance of 1.0873, from which I recommended opening short positions within the day immediately on the rebound, which brought about 25-30 points. It is still very early to say that buyers have coped with the market and dragged the blanket to their side. Today in the first half of the day, they need to protect the support of 1.0835, which simultaneously acts as the middle of the side channel. The formation of a false breakout on it will be a signal to open long positions in the expectation of continued growth of EUR/USD. However, the more important goal is to break through and consolidate above the resistance of 1.0881, which will lead to a more powerful bullish impulse with an exit to the highs of 1.0923 and 1.0972, where I recommend taking the profits. In a scenario of lack of activity from buyers at the level of 1.0835 and the more bad figures for industrial production in the Eurozone, it is best to postpone purchases of the euro to test the lower border of the sideways channel of 1.0787 or open a long position immediately on the rebound from a new local minimum of 1.0728 in the calculation of the upward correction in 30-40 points within the day.
To open short positions on EURUSD, you need:
Sellers need to return to the market, and it will be possible to talk about control from their side only after the pair is fixed below the support of 1.0835 and returns to the moving averages. Only in this scenario, you can open new short positions in the expectation of a repeated decline in EUR/USD in the area of this week's minimum to the support of 1.0787, as well as its breakdown, which will increase pressure on the euro and lead to an update of the area of 1.0728, where I recommend fixing the profits. If the data on industrial production in the Eurozone is not as bad as expected, for sure, the bulls will attempt to increase to the resistance of 1.0881. You can open short positions from there only if a false breakout is formed, but it is best to sell EUR/USD on a rebound from the highs of 1.0923 and 1.0972, counting on correction of 25-30 points within the day.
Signals of indicators:
Moving averages
Trading is conducted just above the 30 and 50 moving averages, which so far indicates the equality of buyers and sellers.
Note: The period and prices of moving averages are considered by the author on the hourly chart H1 and differ from the general definition of the classic daily moving averages on the daily chart D1.
Bollinger Bands
A break in the upper limit of the indicator around 1.0881 may lead to a sharp increase in the Euro. A break of the lower border around 1.0835 will lead to a more serious decline in the pair.
Description of indicators
Díky analytickým přehledům společnosti InstaForex získáte plné povědomi o tržních trendech! Jako zákazníkovi společnosti InstaForex je Vám k dispozici velký počet bezplatných služeb umožňujících efektivní obchodování.


