 Zůstat
Obchodní podmínky
Nástroje


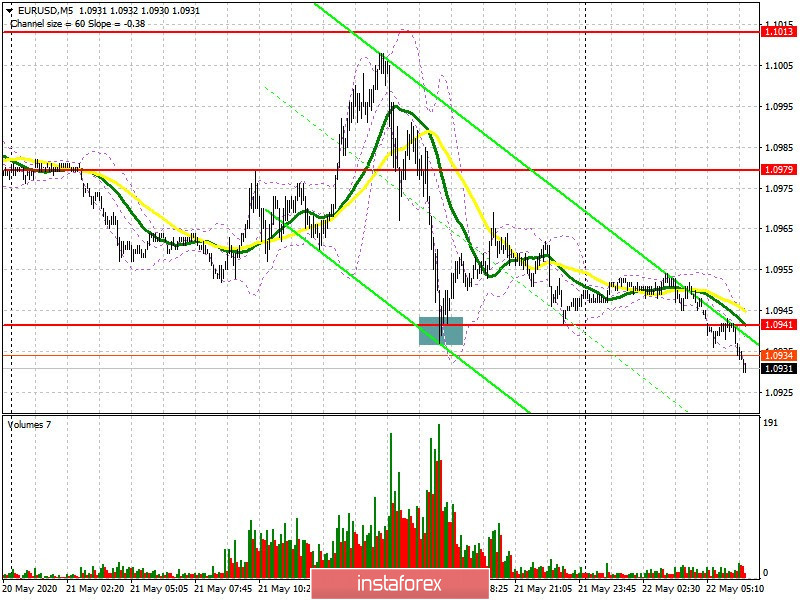
To open long positions on EUR/USD, you need:
The euro's sharp decline yesterday afternoon occurred after good data on US activity, which indicated a weaker slowdown in May, compared with April. As for transactions in the afternoon, I drew attention to the 1.0941 level and advised only to open long positions from it in case of a breakthrough of support at 1.0979. If you look at the 5-minute chart, you will see how the breakout of 1.0979 will result in a sell-off to the area of 1.0941, from which long positions had to be opened on the rebound, which led to an upward correction. However, the 1.0941 level was broken from the third time at the Asian session, which revised the technical picture. At this moment, the bulls will actively defend 1.0923, but forming a false breakout there will be a signal to open long positions, while it is best to delay buying immediately for a rebound until the test of a larger low of 1.0900, counting on a correction of 20-30 points intraday. An equally important task for the bulls will be to return the resistance of 1.0966 to themselves, after this it will be possible to talk about continuing the upward trend and expect a breakthrough of the 10th figure in the 1.1006 area with the release and update of the high of 1.093.
To open short positions on EUR/USD, you need:
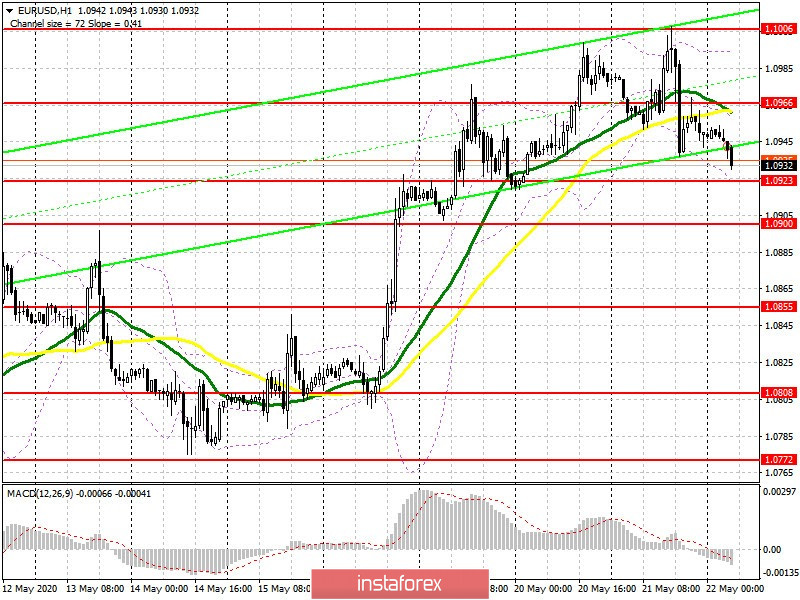
Bears will be waiting for the European Central Bank's monetary policy report, and any hint of an extension to the bond redemption program by the regulator could increase pressure on the euro. The primary objective of the bears will be a breakthrough and consolidation below the support of 1.0923, to which the pair is now aiming for. Surely the first test of this level will rebound, so it is best to sell EUR/USD only after a breakout and consolidation below this level, or on a second test in order to go down further to support 1.0900 and reach a low of 1.0855, where I recommend taking profits. In case the pair grows in the first half of the day, forming a false breakout in the resistance area of 1.0966, where, by the way, the moving averages pass, will also be a good signal to sell. It is possible to sell EUR/USD immediately for a rebound after yesterday's test of the high at 1.1006, based on a downward movement of 25-30 points by the end of the week.
Signals of indicators:
Moving averages
Trade is conducted below 30 and 50 moving averages, which indicates a change in the market direction to the downward.
Note: The period and prices of moving averages are considered by the author on the hourly chart H1 and differs from the general definition of the classic daily moving averages on the daily chart D1.
Bollinger bands
A break of the lower border of the indicator in the region of 1.0923 will increase pressure on the euro, which will lead to another wave of decline in the pair. Growth will be limited by the upper level of the indicator in the area of 1.0995.
Description of indicators
Díky analytickým přehledům společnosti InstaForex získáte plné povědomi o tržních trendech! Jako zákazníkovi společnosti InstaForex je Vám k dispozici velký počet bezplatných služeb umožňujících efektivní obchodování.

