 Zůstat
Obchodní podmínky
Nástroje


To open long positions on EUR/USD, you need:
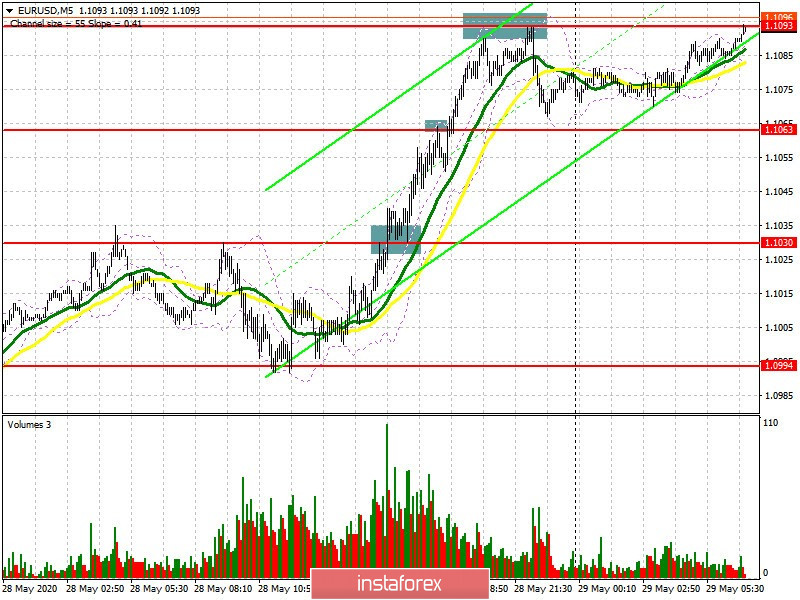
Yesterday's report on US GDP for the first quarter of this year turned out to be worse than forecasts of economists, which caused the euro to strengthen further. If you look at the 5-minute chart, you will clearly see how the breakout of resistance 1.1030 occurred, and then its test from top to bottom, which will result in forming a signal to open long positions, which I recommended doing in yesterday's review for the afternoon. Updating the high of 1.1093 led to a slight rebound in the euro before the US session closed. At the moment, the bulls will focus on resistance 1.1093, consolidating above which, by analogy with yesterday, can only strengthen the bullish trend, which will result in renewing new highs in the areas of 1.1139 and 1.1231, where I recommend taking profit. You must also remember that eurozone inflation data will be released today, which can spoil the mood of buyers. If EUR/USD decreases in the first half of the day, I recommend returning to long positions only after a false breakout has formed in the support area of 1.1063 or buy the euro immediately to rebound from the lows of 1.1030 and 1.0994 with the aim of an upward correction of 20-25 points by the end of the day, like this It was yesterday by analogy with the resistance of 1.1093.
To open short positions on EUR/USD, you need:
The only thing the bears can count on today with such a powerful bullish momentum is the weak inflation rates in the eurozone, which will probably slow down, as well as the US measures against China on the Hong Kong autonomy issue. Forming a false breakout in the resistance area of 1.1093 and any negative background can force the bulls to take profits at the end of the month, which will return pressure on the pair and lead to an update of the low of 1.1063. However, consolidating below this level will not greatly affect the current technical picture, therefore, after a test of the lows 1.1030 and 1.0994, demand for the European currency will remain quite high. With a growth scenario above resistance 1.1093 in the morning, it is best not to rush into short positions, but wait until the high at 1.1139 is updated or sell EUR/USD immediately to rebound from a larger resistance 1.1231. Also, bears can focus on divergence today, which can form on the MACD indicator after an attempt by the bulls to update this week's highs.
Signals of indicators:
Moving averages
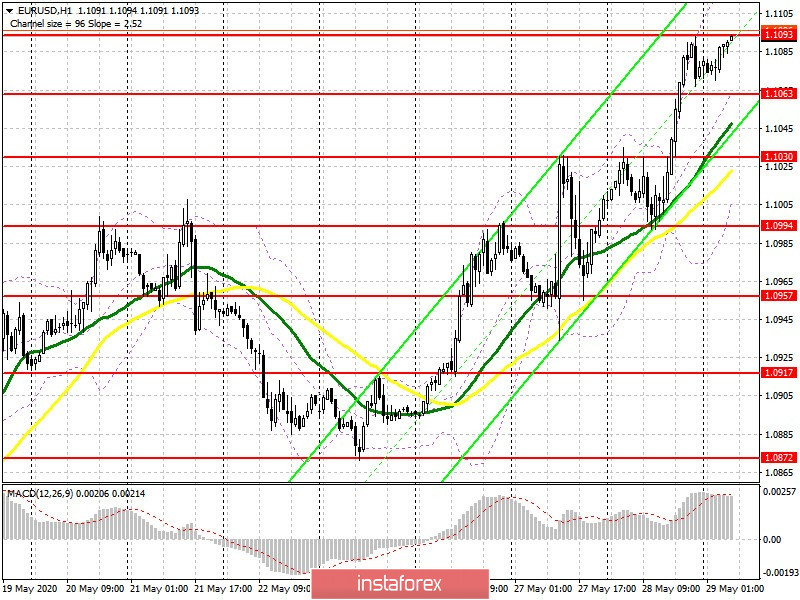
Trade is conducted above 30 and 50 moving averages, which indicates continued growth of the euro in the short term.
Note: The period and prices of moving averages are considered by the author on the hourly chart H1 and differs from the general definition of the classic daily moving averages on the daily chart D1.
Bollinger bands
The upper border of the indicator in the region of 1.1130 will act as resistance. In case the euro falls, support will be provided by the lower border in the area of 1.1020.
Description of indicators
Díky analytickým přehledům společnosti InstaForex získáte plné povědomi o tržních trendech! Jako zákazníkovi společnosti InstaForex je Vám k dispozici velký počet bezplatných služeb umožňujících efektivní obchodování.

