 Zůstat
Obchodní podmínky
Nástroje


To open long positions on EURUSD, you need:
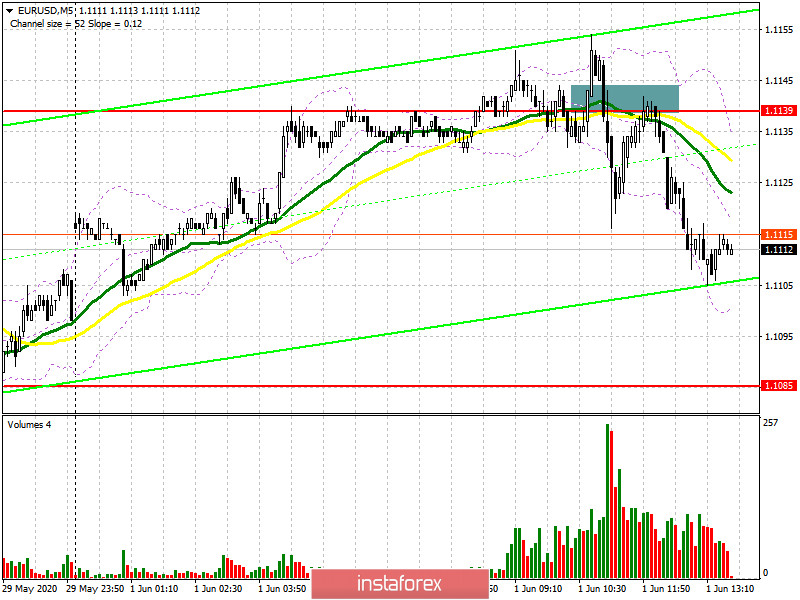
The data released in the first half of the day on business activity in the manufacturing sector of the Eurozone countries were not as optimistic as expected by economists, which did not allow the bulls to continue the growth of the euro/dollar pair. Sellers managed to take advantage of this moment and after forming a false breakout, they began to actively sell the euro. If you look at the 5-minute chart, you will see how an unsuccessful attempt to break above the resistance of 1.139 led to the pair returning to this level, and then a repeated test of this area from the bottom up became a signal to open short positions. The formation of divergence on the MACD indicator was also an additional signal to sell the euro, which I mentioned. At the moment, the market is controlled by bears, and buyers again need to play out the morning scenario. The further upward movement will depend on data on manufacturing activity in the US, as well as on whether the bulls will be able to gain a foothold above the range of 1.1139. Only after a successful breakout, I recommend continuing to open long positions above this resistance with the main goal of updating the maximum of 1.1183 and reaching a larger level of 1.1231, where you can fix profits. If the pressure on the euro continues in the second half of the day, it is best to postpone purchases and wait for a correction to the support area of 1.1085, provided that a false breakout is formed there or open long positions immediately to rebound from the larger lows of 1.1034 and 1.0994.
To open short positions on EURUSD, you need:
Sellers coped with the morning task perfectly and did not let the pair go above the resistance of 1.139. As long as trading is below this level, the market will be on their side. Now, to confirm its advantage, we need good data on manufacturing activity in the US, which will increase pressure on the European currency and lead to an update of the minimum of 1.1085, where we can observe the first stop of the current downward momentum formed from the level of 1.139. However, it is best to talk about the possible formation of a downward trend only after fixing below the support of 1.1085, which will collapse the euro/dollar pair to the area of 1.1034 and 1.0994, where I recommend fixing the profits. In a scenario of further growth of the euro in the second half of the day, it is best to return to short positions to rebound from a maximum of 1.1183 or even higher, from a larger resistance of 1.1231.
Signals of indicators:
Moving averages
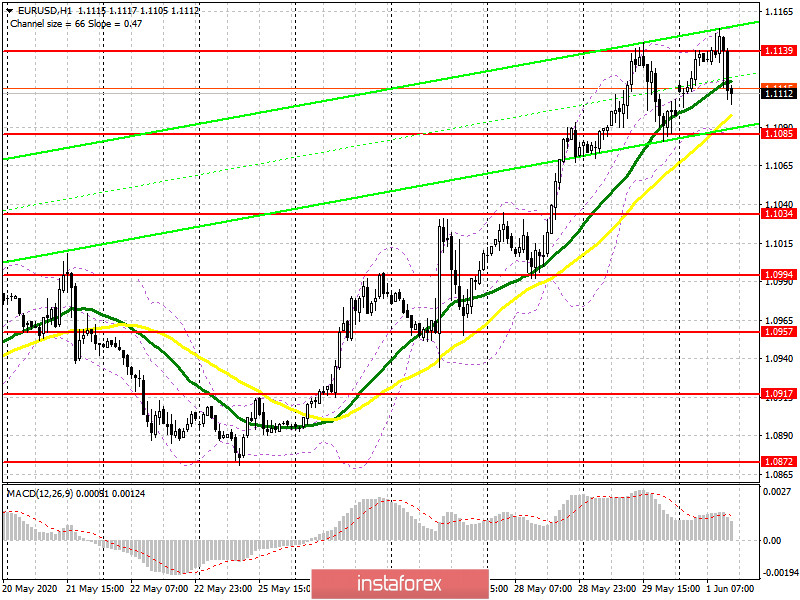
Trading is conducted in the area of 30 and 50 daily moving averages, which indicates the return of market equilibrium in the short term.
Note: The period and prices of moving averages are considered by the author on the hourly chart H1 and differ from the general definition of the classic daily moving averages on the daily chart D1.
Bollinger Bands
A break in the lower border of the indicator around 1.1085 will increase pressure on the euro.
Description of indicators
Díky analytickým přehledům společnosti InstaForex získáte plné povědomi o tržních trendech! Jako zákazníkovi společnosti InstaForex je Vám k dispozici velký počet bezplatných služeb umožňujících efektivní obchodování.


