 Zůstat
Obchodní podmínky
Nástroje


To open long positions on EUR/USD, you need:
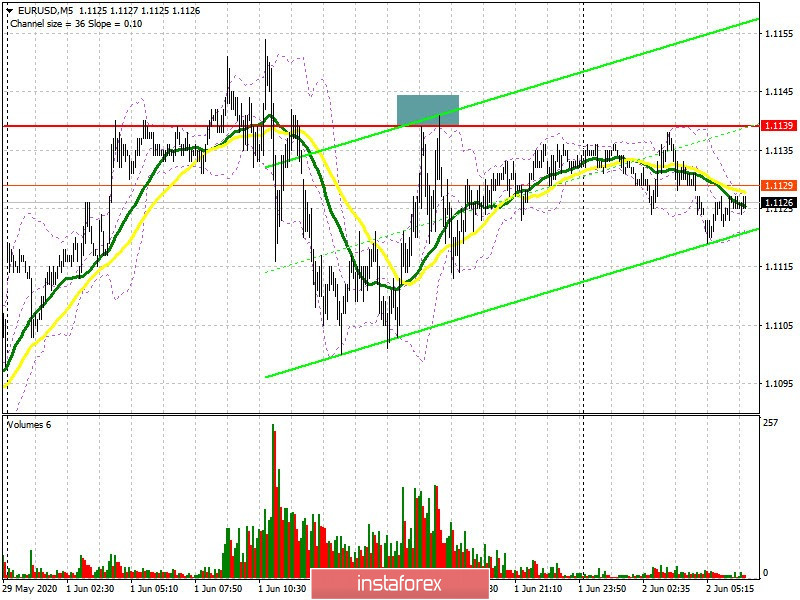
Yesterday's attempts to break above resistance of 1.1139 in the US session again failed. If you look at the 5-minute chart, you will see how the bears every time they approach the level of 1.1139 again actively sold the euro, which kept the pair in the side channel at the moment. However, in favor of buyers, it is worth noting the formed "triangle" technical model, a breakthrough of which can lead to a new bullish momentum. The Commitment of Traders (COT) reports for May 26 recorded a sharp increase in both long and short positions, which indicates the continued high interest in buying the European currency at current prices and the very likely continuation of the bull market. In the report, one can observe the growth of short non-commercial positions from the level of 95,194 to the level of 99,812, while the long non-commercial positions jumped much more seriously, from 167,756 to 175,034. As a result, the positive non-commercial net position also increased and amounted to 75,222, against 72,562, which indicates an increase in interest in purchases of risky assets at current prices. As for the intraday strategy, further movement will depend on whether the bulls manage to gain a foothold above the 1.1139 range or not. Important fundamental statistics are not expected to be released today, and therefore, only after a successful breakout of the 1.1139 level and the upper border of the triangle, I recommend continuing to open long positions with the main goal of updating the high of 1.1183, and reaching a larger level of 1.1231, where you can take profit. If EUR/USD does not grow above 1.1139 in the morning, it is best to postpone purchases and wait for the euro to correct in the support area of 1.1085, or open long positions immediately to rebound from the larger lows of 1.1034 and 1.0994.
To open short positions on EUR/USD, you need:
Sellers have once again tried to stop the bull market today in the Asian session and are actively not letting the pair go above resistance 1.1139. Now the bears need to wait for another false breakout to form in this area, which will be the first signal to open short positions, the goal of which will be support 1.1085. Consolidating below this level will lead to a more serious sale of EUR/USD to the area of lows 1.1034 and 1.0994, where I recommend taking profits. In case the euro grows further in the first half of the day, it is best to return to short positions to rebound from a high of 1.1183, or even higher, from a larger resistance of 1.1231, based on a correction of 20-30 points by the end of the day. Given that there is no way out of important fundamental statistics today, buyers may be left without serious support after breaking through the upper border of the triangle in the resistance area of 1.1139, so a breakout of the lower border of this technical figure will also be a signal to open short positions.
Signals of indicators:
Moving averages
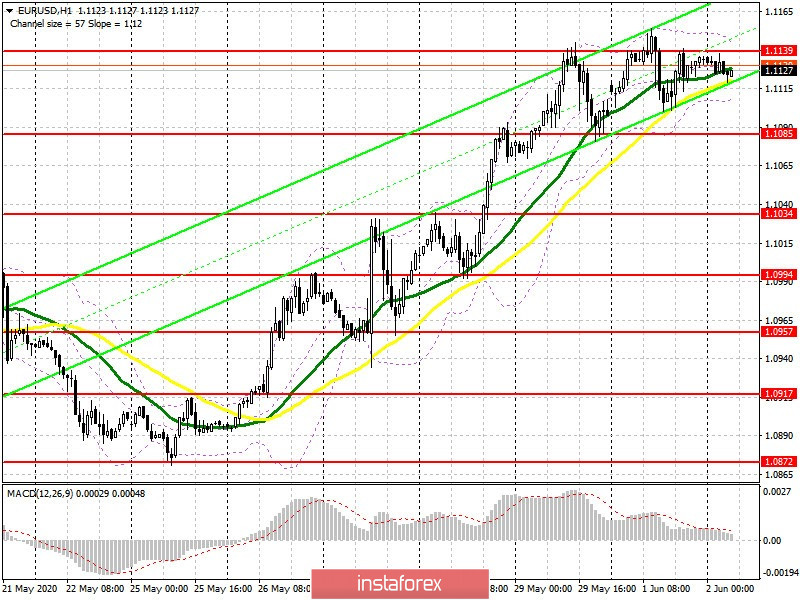
Trading is carried out in the region of 30 and 50 moving average, which indicates the possible end of the bull market.
Note: The period and prices of moving averages are considered by the author on the hourly chart H1 and differs from the general definition of the classic daily moving averages on the daily chart D1.
Bollinger bands
A break of the upper boundary of the indicator in the region of 1.1140 will lead to a new upward momentum of the pair. A break of the lower border of the indicator in the area of 1.1105 will increase pressure on the euro.
Description of indicators
Díky analytickým přehledům společnosti InstaForex získáte plné povědomi o tržních trendech! Jako zákazníkovi společnosti InstaForex je Vám k dispozici velký počet bezplatných služeb umožňujících efektivní obchodování.


