 Zůstat
Obchodní podmínky
Nástroje


To open long positions on EURUSD, you need:
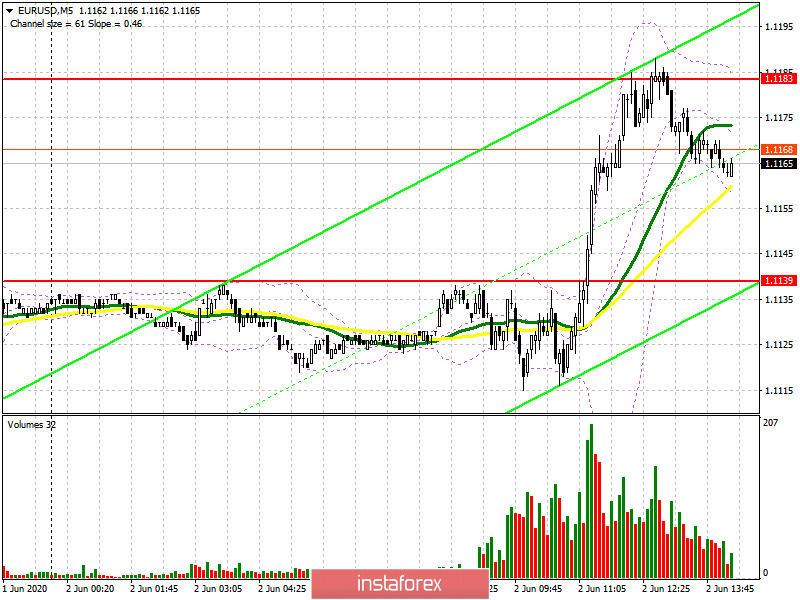
Given that important fundamental statistics are not released today, the entire focus in the first half of the day was at the resistance level of 1.139, the break of which led to a new powerful wave of euro growth. Unfortunately, it was not possible to wait for a signal to buy the euro, and a breakthrough of the upper border of the triangle led to a sharp strengthening of the euro. If you look at the 5-minute chart, the breakdown was very fast without any fixing at the level. But even if you missed this growth, you should not be upset. There is an American session where you can wait for the downward movement of the euro already in the support area of 1.1139, and the formation of a false breakout there will be a good signal to open long positions in the hope of continuing the growth of the euro in the short term. An equally important task for buyers will be to break through and consolidate above the resistance of 1.1183, which they rested against today in the first half of the day, which I drew attention to in my review. Only fixing above this range will open a direct road to the area of highs of 1.1231 and 1.1295, where I recommend fixing the profits. If there is no demand for the euro in the support area of 1.1139 and the pair is growing rapidly from this level, it is best to postpone long positions until the minimum of 1.1085 is updated or buy EUR/USD immediately for a rebound from the support of 1.1034 calculated for correction of 25-30 points at the end of the day.
To open short positions on EURUSD, you need:
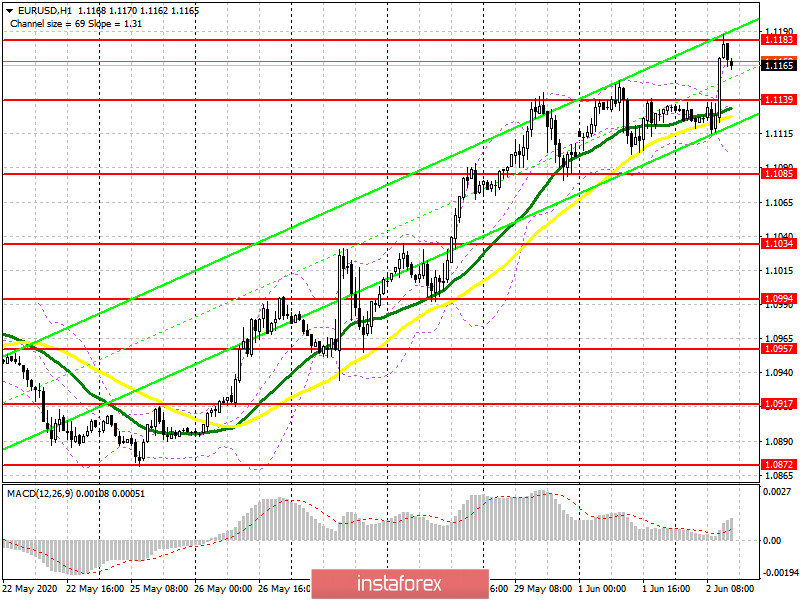
Riots in the US may be one of the reasons for the weakening dollar in recent days, and given the morning forecast and COT reports, where the number of people wishing to buy the euro clearly prevails over those wishing to sell, it is not surprising that the pair will continue to strengthen today in the morning. The bears have so far focused on the resistance of 1.1183, from which it was possible to open short positions, as I mentioned in the morning forecast. As long as trading is below this range, there is a probability of a test of the 1.139 level, which will now serve as a support. However, it is possible to talk about a return to the market of larger sellers only after fixing below this range, which will necessarily lead to an update of the lows of 1.1085 and 1.1034, where I recommend fixing the profits. If the demand for the euro persists in the second half of the day, and the bears miss the resistance of 1.1183, then it is best to sell EUR/USD only after updating the maximum of 1.1231 or even higher – from a large resistance of 1.1295 in the calculation of correction of 30-35 points within the day.
Signals of indicators:
Moving averages
Trading is above the 30 and 50 day moving averages, which indicates a continuation of the bull market in the short term.
Note: The period and prices of moving averages are considered by the author on the hourly chart H1 and differ from the general definition of the classic daily moving averages on the daily chart D1.
Bollinger Bands
If the euro falls in the second half of the day, the lower border of the indicator around 1.1095 will provide support. Breaking the upper limit in the area of 1.1183 will lead to the new strong growth of the euro.
Description of indicators
Díky analytickým přehledům společnosti InstaForex získáte plné povědomi o tržních trendech! Jako zákazníkovi společnosti InstaForex je Vám k dispozici velký počet bezplatných služeb umožňujících efektivní obchodování.


