 Zůstat
Obchodní podmínky
Nástroje


To open long positions on EURUSD, you need:
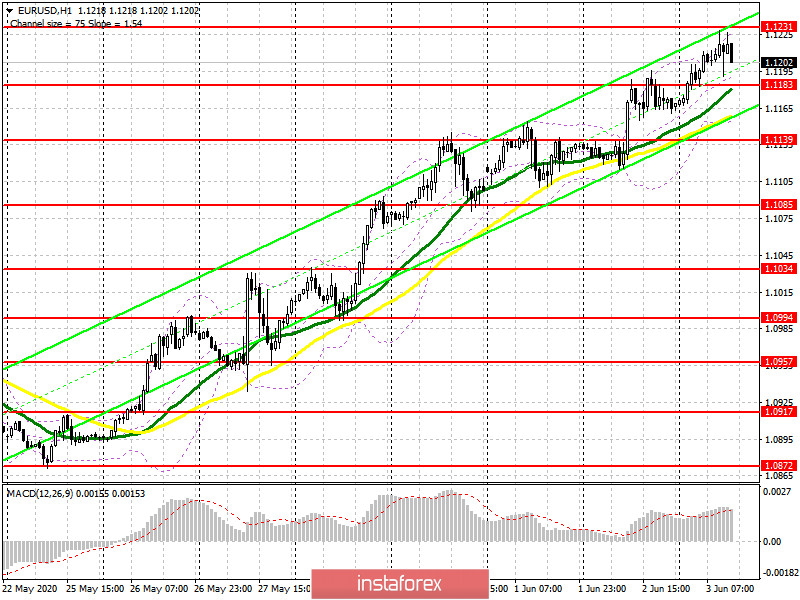
In the first half of the day, I paid attention to the resistance level of 1.1231, which buyers could not reach, which is a very worrying signal for the bulls. Even good indicators in the service sector did not lead to a new wave of growth, as the data was offset by a weak report on the German labor market and a sharp decline in producer prices in the Eurozone. If you look at the 5-minute chart, you will see how buyers tried several times to get close to the level of 1.1231 but failed to break through this range, which left the technical picture in EUR/USD unchanged. Only fixing above the resistance of 1.1231 will lead to a new upward wave of EUR/USD with an exit to the highs of 1.1295 and 1.1344, where I recommend fixing the profits. The formation of a false breakout at the level of 1.1183 will also be a signal to open long positions. However, you need to understand that as soon as the pair returns to this level, the pressure on the euro will increase sharply, so it is best to postpone purchases until the support test of 1.1139, just above which the moving averages pass or buy EUR/USD immediately on the rebound from the minimum of 1.1085 with the goal of an upward correction of 30-35 points by the close of the day.

To open short positions on EURUSD, you need:
After an unsuccessful move above the level of 1.1231, optimism in the ranks of sellers began to gradually strengthen, as well as the calculation for a downward correction of the pair in the second half of the day. However, it is best to wait for the resistance update of 1.1231 and watch sales from there only if a false breakout is formed there. Larger highs, from which you can open short positions immediately on the rebound, are in the area of 1.1295 and 1.1344. An equally important task for bears will be to return EUR/USD to the support level of 1.1183, as fixing below this range may lead to the demolition of stop orders of speculative players, which will cause a downward correction in the euro and lead to an update of the support of 1.139, where the market will again try to return to the bulls. The longer-term goal of sellers will be at least 1.1085, where I recommend fixing the profits.
Signals of indicators:
Moving averages
Trading is above the 30 and 50 daily moving averages, which indicates a continuation of the bull market in the short term.
Note: The period and prices of moving averages are considered by the author on the hourly chart H1 and differ from the general definition of the classic daily moving averages on the daily chart D1.
Bollinger Bands
If the euro falls in the second half of the day, the lower border of the indicator around 1.1155 will provide support. Breaking the upper limit in the area of 1.1225 will lead to the new strong growth of the euro.
Description of indicators
Díky analytickým přehledům společnosti InstaForex získáte plné povědomi o tržních trendech! Jako zákazníkovi společnosti InstaForex je Vám k dispozici velký počet bezplatných služeb umožňujících efektivní obchodování.

