 Zůstat
Obchodní podmínky
Nástroje


To open long positions on EURUSD, you need:
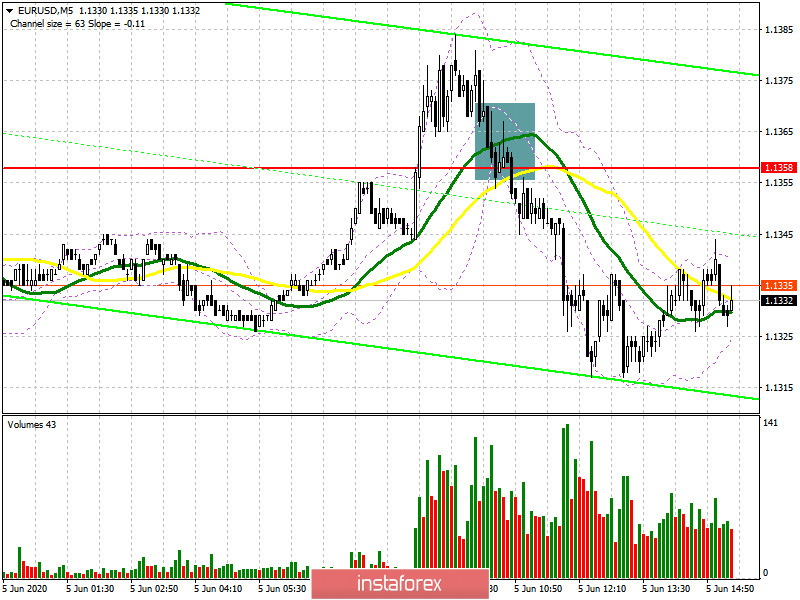
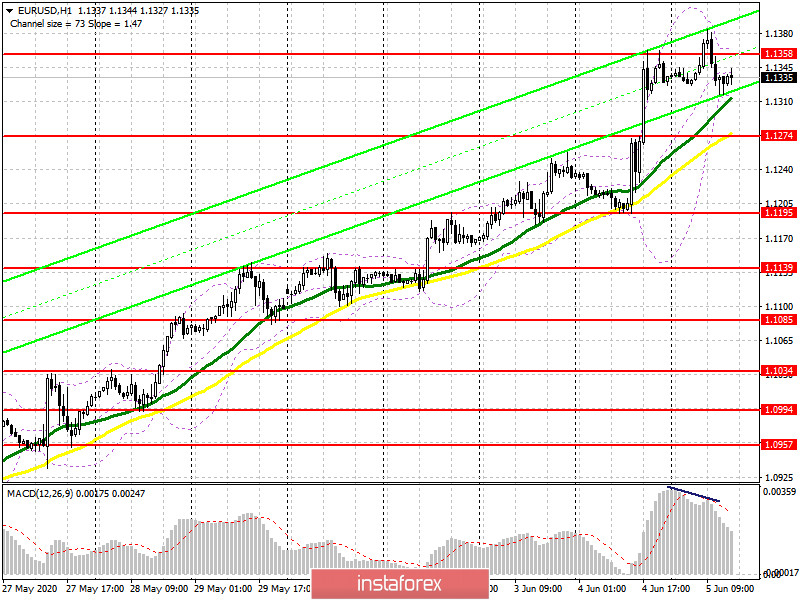
In the first half of the day, I paid attention to the resistance of 1.1358 and recommended opening long positions from it only after a breakout and consolidation above this level. If you look at the 5-minute chart, you will see how the bulls managed to break above 1.1358, but when re-testing this range from top to bottom, it was not possible to get the necessary entry point. As a result, the trade returned to the range of 1.1358, without forming a signal to buy the euro. In the second half of the day, the focus will be on the US labor market and reports on the unemployment rate, since nothing has changed from a technical point of view. Only a repeated breakout and consolidation above the resistance of 1.1358 will preserve the attractiveness of EUR/USD and lead to another wave of strengthening to the highs of 1.1422 and 1.1459, where I recommend fixing the profits. However, if the data on the state of the US labor market turns out to be better than the forecasts of economists, this will lead to a decrease in the pair in the second half of the day. In this case, you can expect to buy after the correction to the support area of 1.1274, provided that a false breakout is formed or open long positions immediately on the rebound after the test of the minimum of 1.1195.
To open short positions on EURUSD, you need:
Sellers coped with the task in the first half of the day and did not let EUR/USD above the resistance of 1.1358, forming a false breakout, which allowed to form a signal to sell the euro. While trading will be conducted below this range, you can count on a downward correction of the euro to the support area of 1.1274, where I recommend fixing the profits. With better data on the US labor market, bears may try to reach the support of 1.1195, but this is certainly unlikely. If the upward trend in EUR/USD continues, then after the breakout of the resistance of 1.1358, I recommend considering new short positions only after updating the resistance of 1.1422 or selling the euro immediately to rebound from the maximum of 1.1459 with the aim of a downward correction of 30-40 points within the day.
Signals of indicators:
Moving averages
Trading is conducted above the 30 and 50 daily moving averages, which indicates the continuation of the bull market.
Note: The period and prices of moving averages are considered by the author on the hourly chart H1 and differ from the general definition of the classic daily moving averages on the daily chart D1.
Bollinger Bands
A break in the lower border of the indicator around 1.1320 will increase pressure on the euro. Breaking the upper limit of the indicator in the area of 1.1358 will lead to a new wave of euro growth.
Description of indicators
Díky analytickým přehledům společnosti InstaForex získáte plné povědomi o tržních trendech! Jako zákazníkovi společnosti InstaForex je Vám k dispozici velký počet bezplatných služeb umožňujících efektivní obchodování.

