 Zůstat
Obchodní podmínky
Nástroje


The pair continued its upward rally last week. As it moved up, the price tested the resistance line 1.1383 (red bold line) and after that, it declined and closed the weekly candle 93 points lower. The price for the coming week may continue to move down, in a pullback.
Trend analysis.
This week, the price from the level of 1.1290 (closing of the last weekly candle) may start moving down with the first target 1.1206 - a pullback level of 23.6% (red dashed line). If this level is broken down, the price will continue to decline to the next lower target at 1.1098 - a pullback level of 38.2% (red dashed line). From this level, it is likely that the price will begin to move up with the target at 1.1372 - the resistance line (red bold line).
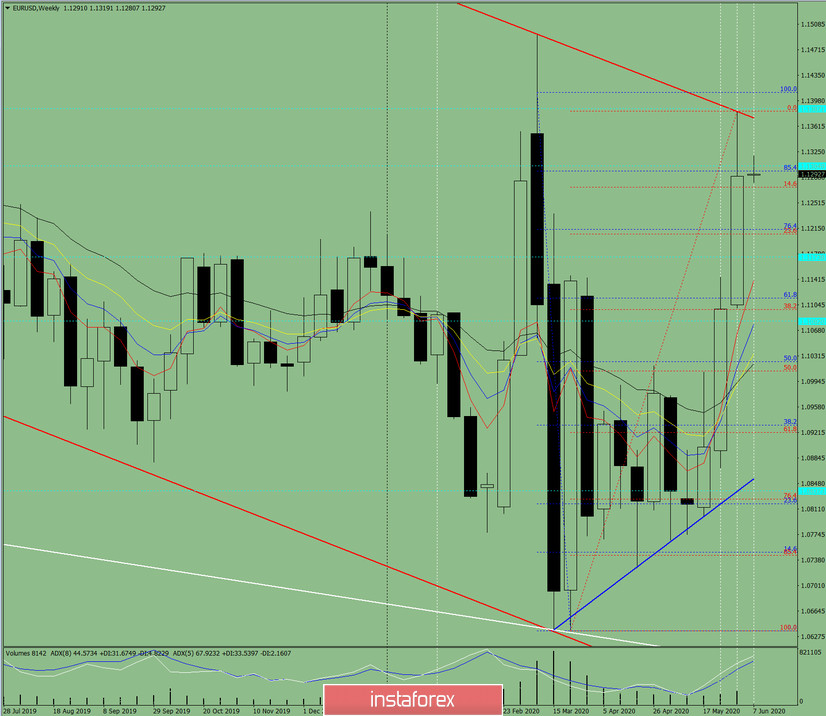
Fig. 1 (weekly schedule).
Comprehensive analysis:
- indicator analysis - down;
- Fibonacci levels - down;
- volumes - down;
- candlestick analysis - down;
- trend analysis - down;
- Bollinger Lines - down;
- monthly chart - up.
The conclusion of a comprehensive analysis is a downward movement.
The overall result of calculating the candle of the EUR/USD currency pair according to the weekly chart: the price of the week is likely to have a downward trend, with the absence of an upper shadow for the weekly black candlestick (Monday - down) and the presence of a second lower shadow (Friday - up).
The lower weekly target of 1.1098 is a pullback level of 38.2% (red dashed line).
An unlikely scenario: the price, moving down, after reaching a pullback level of 23.6% - 1.1206 (red dotted line) may begin to increase.
Díky analytickým přehledům společnosti InstaForex získáte plné povědomi o tržních trendech! Jako zákazníkovi společnosti InstaForex je Vám k dispozici velký počet bezplatných služeb umožňujících efektivní obchodování.

