 Zůstat
Obchodní podmínky
Nástroje


To open long positions on EUR/USD, you need:
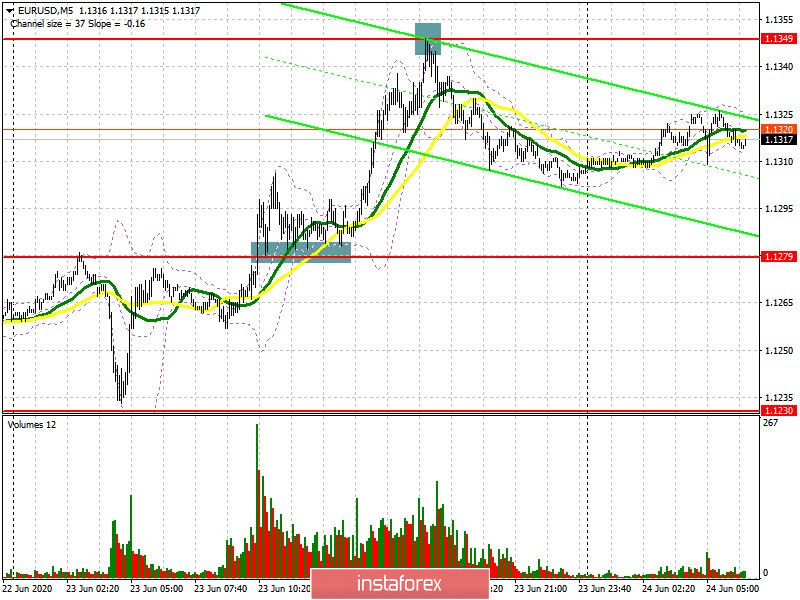
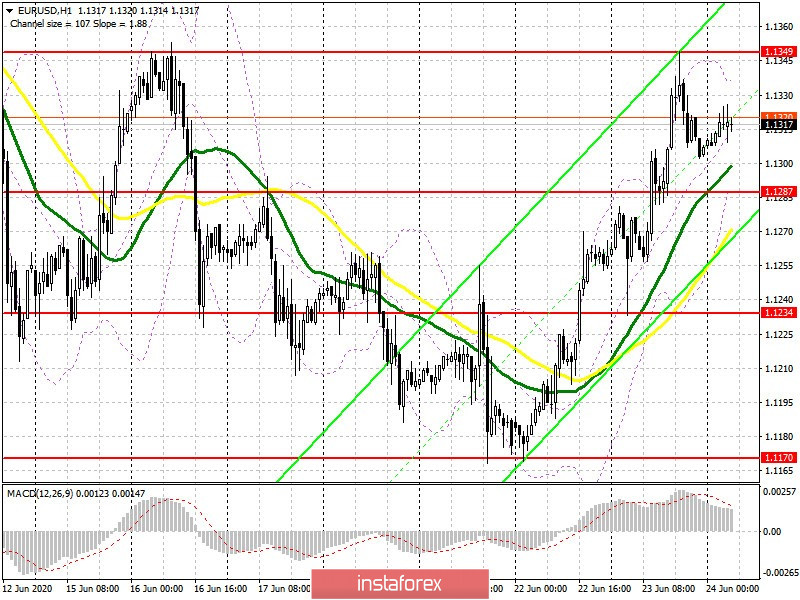
In my forecast for the afternoon, I drew attention to the sales that took place after updating the resistance level of 1.1349. If you look at the 5-minute chart, you will see that after the breakout and consolidating above resistance 1.1279, when a buy signal was formed, the bulls task was to test resistance at 1.1349, which they successfully did. After that, a sell signal was formed, and the market began an intraday downward correction. At the moment, the hourly chart shows how the pair stands in the side channel and where it will continue to move, one can only guess. Buyers need to break through and gain a foothold above the level of 1.1349 to continue the euro's growth. This will only be a signal to open long positions in the hope of updating the high of 1.1418, which is the target for the middle of this week. Another task is to update the level of 1.1462, where I recommend taking profits. With the downward correction of EUR/USD in the morning against the background of weak data for Germany from the Ifo Institute, it is best to return to long positions only after a false breakout has formed in the support area of 1.1287, since this level may lose its power. If there is no activity on it, it is best to buy for a rebound from yesterday's low in the area of 1.1234 while expecting a correction of 25-30 points. It is also necessary to remember about the COT reports, which clearly indicates maintaining the bullish momentum in the market. Let me remind you that during the reporting week a short non-commercial position was recorded from the level of 89,020 to the level of 69,988, while long non-commercial positions sharply rose from the level of 184,669 to the level of 187,120. As a result, the positive non-commercial net position rose again and reached 117,132, against 95,639, which indicates an increase in interest in buying risky assets even at current prices high enough for the market.
To open short positions on EUR/USD, you need:
Sellers quickly rehabilitated and showed themselves from the resistance level of 1.1349 yesterday, from which I recommended opening short positions. At the moment, the bears will be waiting for reports on the indicator of conditions and expectations of the German business environment from the IFO, which may put pressure on the European currency. Poor performance in June may lead to forming a false breakout in the resistance area of 1.1349. In such a scenario can we now sell in this area while expecting the pair to return to support 1.1287, where I recommend taking profits. An additional signal to sell could be divergence, which is now being formed on the MACD indicator. An equally important task for sellers will be to return and consolidate below the level of 1.1287, which will lead to a larger downward correction of EUR/USD to the area of yesterday's low of 1.1234. In case there are no active sales in the 1.1349 area, it is best to postpone short positions until the high of 1.1418 is updated.
Signals of indicators:
Moving averages
Trading above 30 and 50 moving averages, but their breakdown can lead to a downward correction in euros.
Note: The period and prices of moving averages are considered by the author on the hourly chart H1 and differs from the general definition of the classic daily moving averages on the daily chart D1.
Bollinger bands
A break of the upper border of the indicator at 1.1340 may lead to an increase in the euro. A break of the lower border of the indicator in the area of 1.1287 will increase pressure on the euro.
Description of indicators
Díky analytickým přehledům společnosti InstaForex získáte plné povědomi o tržních trendech! Jako zákazníkovi společnosti InstaForex je Vám k dispozici velký počet bezplatných služeb umožňujících efektivní obchodování.


