 Zůstat
Obchodní podmínky
Nástroje


To open long positions on EURUSD, you need:
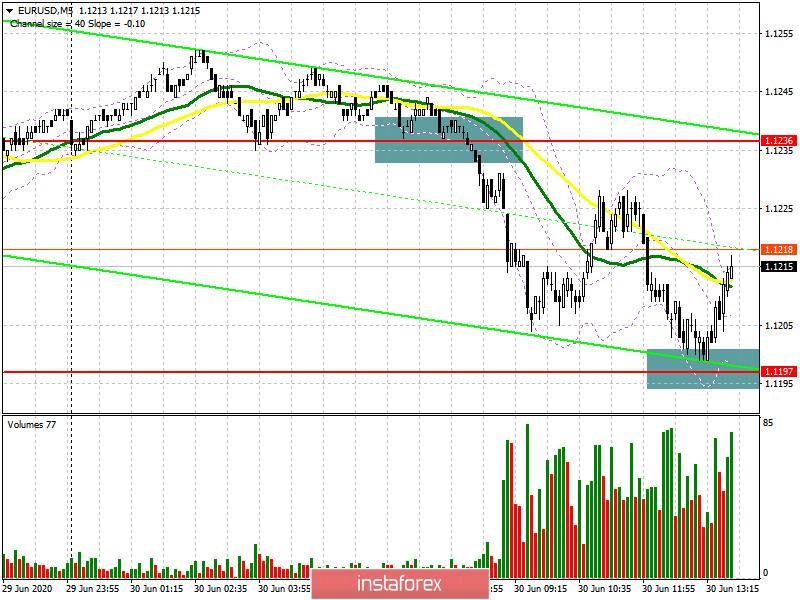
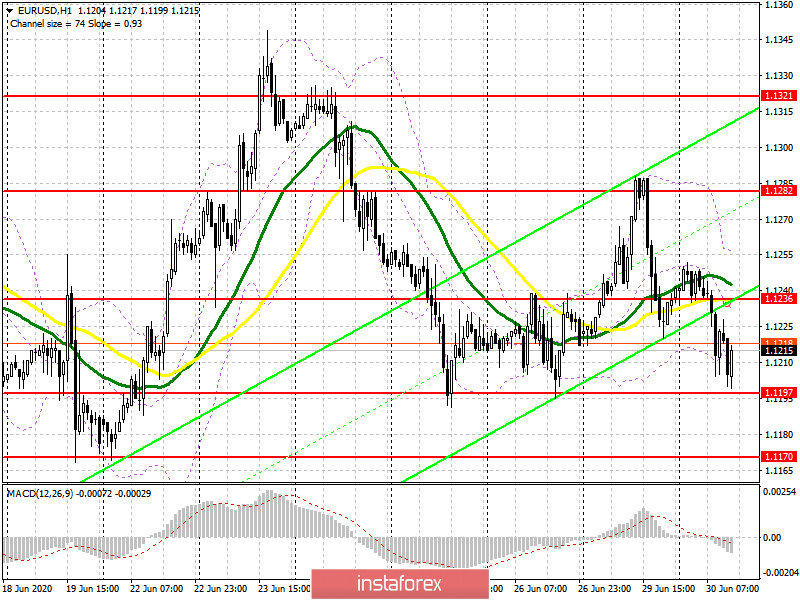
Although the bears did not leave the bulls almost any chance in the first half of the day, however, good data on inflation in the Eurozone managed to keep the euro from a new wave of falls and from breaking the lows of last week in the area of 1.1197. In the initial test of this level, I recommended opening long positions in my morning forecast. It is at the level of 1.1197 that the main emphasis is now placed. As for the entry points to short positions in the first half of the day, if you look at the 5-minute chart, you will see how the bears achieved a break through the support of 1.1236 and after a small attempt to correct this level, they continued to push the euro down, reaching 1.1197. The task of buyers for the second half of the day will be to hold the pair above this area, but only the formation of a false breakout there will be an additional signal to buy EUR/USD. If there is no active growth by the opening of the US session, it is best to postpone long positions until the update of the minimum of 1.1170 and buy euros there immediately for a rebound in the expectation of a small correction of 250-30 points within the day. A break of 1.1197 will indicate a complete resumption of the bearish trend in the euro. This is why this level is so important for both of them today. An equally important task for the bulls will be to close the day above the resistance of 1.1236, after which you can count on a second wave of growth of EUR/USD to the maximum of 1.1282, where I recommend fixing the profits.
To open short positions on EURUSD, you need:
The inflation data weakened confidence among sellers, who quite predictably stumbled on the support of 1.1197. However, a repeated return to this level in the second half of the day and consolidation under it will be an additional signal to open short positions, which will finally pull the market to the side of sellers and return the pair to a downward trend. This scenario will open a direct path to the lows of 1.1170 and 1.1106, where I recommend fixing the profits. If the bulls turn out to be stronger, and the data on consumer confidence in the US will not be as good as expected, it is best to postpone short positions until the formation of a false breakout at the resistance level of 1.1236 or sell EUR/USD immediately to rebound from the week's high in the area of 1.1282, counting on a correction of 20-25 points within the day.
Signals of indicators:
Moving averages
Trading is conducted below the 30 and 50 daily moving averages, which indicates that the bears are trying to return the market to their side.
Note: The period and prices of moving averages are considered by the author on the hourly chart H1 and differ from the general definition of the classic daily moving averages on the daily chart D1.
Bollinger Bands
A break in the lower border of the indicator around 1.1210 will increase pressure on the euro, while growth will be limited by the resistance of 1.1260.
Description of indicators
Díky analytickým přehledům společnosti InstaForex získáte plné povědomi o tržních trendech! Jako zákazníkovi společnosti InstaForex je Vám k dispozici velký počet bezplatných služeb umožňujících efektivní obchodování.


