 Zůstat
Obchodní podmínky
Nástroje


Trend analysis.
In July, it is possible to continue the upward movement, with the first goal 1.1334 - the resistance line (red bold line). If this line breaks up, the next upper target is 1.1422 - the upper fractal (blue dotted line) and the final monthly target is 1.1546 – the upper border of the Bollinger line indicator (black dotted line). From this level, it is possible to work down.
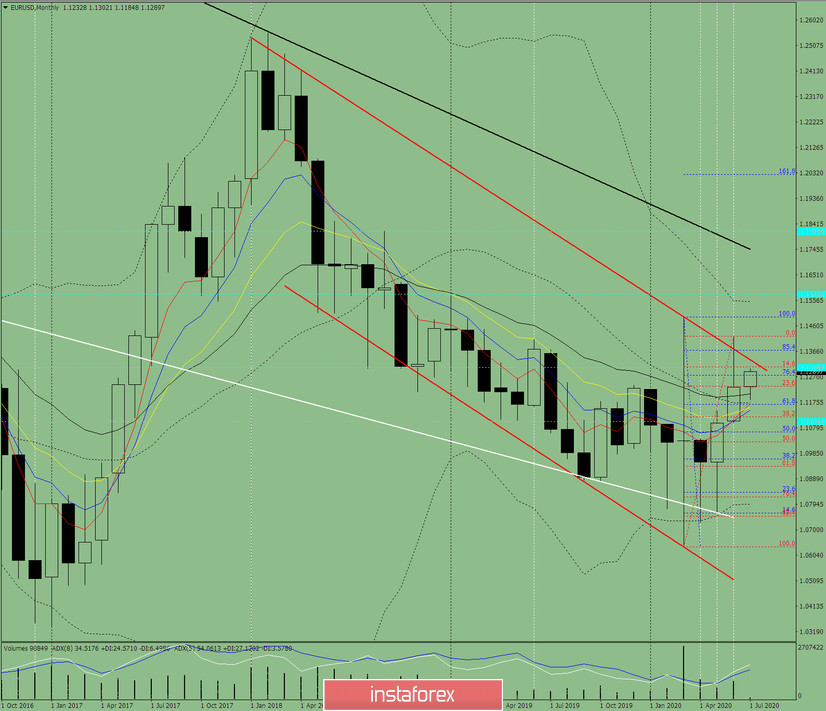
Fig. 1 (monthly chart).
Indicator Analysis:
- indicator analysis - up;
- Fibonacci levels - up;
- volumes - up;
- candlestick analysis - up;
- trend analysis - up;
- Bollinger Lines - up;
The conclusion of a comprehensive analysis is most likely the top job.
The total result of calculating the candle of the EUR/USD currency pair according to the monthly chart: the price will most likely have an upward trend with the absence of the first lower shadow (the first week of the month is the upper one) and the absence of the second upper shadow (the last week is white).
The upper scenario: from the level of 1.1233 (closing of the June monthly candle), we have the upper target of 1.1334 - the resistance line (red bold line).If this line breaks up, we can continue to the next upper target of 1.1422 - the upper fractal (blue dotted line) and the final monthly target is 1.1546 – the upper border of the Bollinger line indicator (black dotted line).
An unlikely scenario: when moving up and reaching the resistance line 1.1334 (red bold line) - working down with the target 1.1120 - a pullback level of 38.2% (red dashed line) is unlikely. The next lower target of 1.1027 is a pullback level of 50.0% (red dashed line).
Díky analytickým přehledům společnosti InstaForex získáte plné povědomi o tržních trendech! Jako zákazníkovi společnosti InstaForex je Vám k dispozici velký počet bezplatných služeb umožňujících efektivní obchodování.

