 Zůstat
Obchodní podmínky
Nástroje


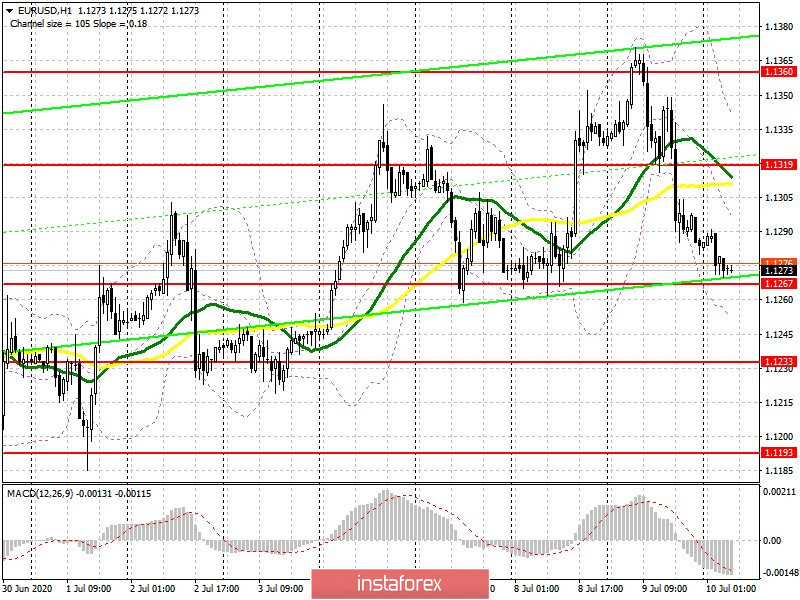
To open long positions on EUR/USD, you need:
Yesterday's data on the state of the US labor market and on the slowdown in the decrease in the number of applications for unemployment benefits in the US put strong pressure on the euro and the pound, which led to strengthening the US dollar. The breakout of the 1.1319 support, as expected, occurred along with a strong wave of EUR/USD falling to the area of a low of 1.1267, which is now the main trading area. Today, there are a number of average reports for Germany, France and Italy, and poor indicators can only increase the pressure on the pair. Therefore, at the moment, the task of the bulls is to protect the support of 1.1267, since its breakout will lead to a break in the upward trend formed on July 1. I advise opening long positions from this range only after forming a false breakout. When the support breaks 1.1267, it is best to wait for the update of the new low of 1.1233 and open long positions from it immediately for a rebound, counting on a correction of 20-25 points within the day. Larger bulls will prefer to wait for the update of the 1.1193 area. An equally important task will be to return EUR/USD to the resistance level of 1.1319, consolidating above it will be an additional signal to buy, which can lead to the week's high in the area of 1.1360, where I recommend taking profits. Let me remind you that the Commitment of Traders (COT) reports for June 30 recorded an increase in short positions and a sharp reduction in long ones. This indicates that market participants are taking a more cautious approach to the euro last week, as well as the lack of people willing to buy the single currency when it grows at higher prices. The report shows an increase in short non-commercial positions from the level of 72,368 to the level of 81,432, while long non-commercial positions decreased from the level of 190,816 to the level of 180,387. As a result, the positive non-commercial net position decreased to 98,955 against 118,448, which indicates a slowdown in the growth of interest in purchasing risky assets at current prices. So don't be surprised if the pressure on the euro persists at the end of this week, and we will see an update to the lows of the previous one.
To open short positions on EUR/USD, you need:
Yesterday's news on the choice of the Eurogroup president did not have a significant impact on the pair. Today sellers of the euro will have to wait for a weak report on inflation in Germany and industrial production in France and Italy. Poor indicators can lead to a breakout of the 1.1267 support, consolidating under it will be a signal to open short positions in the euro in the hope of pulling down and updating the larger low of 1.1233, where I recommend taking profits. The 1.1193 area is the long-term goal. If the pair grows in the first half of the day, it is best to stop selling before forming a false breakout in the area of resistance 1.1319, or open short positions immediately to rebound from the larger resistance 1.1360, counting on a downward correction by the end of the day of at 20-25 points.
Indicator signals:
Moving averages
Trading is conducted below 30 and 50 moving averages, which indicates a break in the bullish trend.
Note: the period and prices of moving averages are considered by the author on the hourly chart H1 and differ from the general definition of the classic daily moving averages on the daily chart D1.
Bollinger Bands
If the pair declines, the lower border of the indicator around 1.1275 will provide support.
Description of indicators
Díky analytickým přehledům společnosti InstaForex získáte plné povědomi o tržních trendech! Jako zákazníkovi společnosti InstaForex je Vám k dispozici velký počet bezplatných služeb umožňujících efektivní obchodování.

