 Zůstat
Obchodní podmínky
Nástroje


Trend analysis.
The price from the level of 1.1655 (closing of the last weekly candle) may continue to move upward with the target at 1.1746 - the resistance line (black thick line) this week. Upon reaching this line, it is possible to work downwards with the target of 1.1581 - a pullback level of 14.6% (red dotted line).
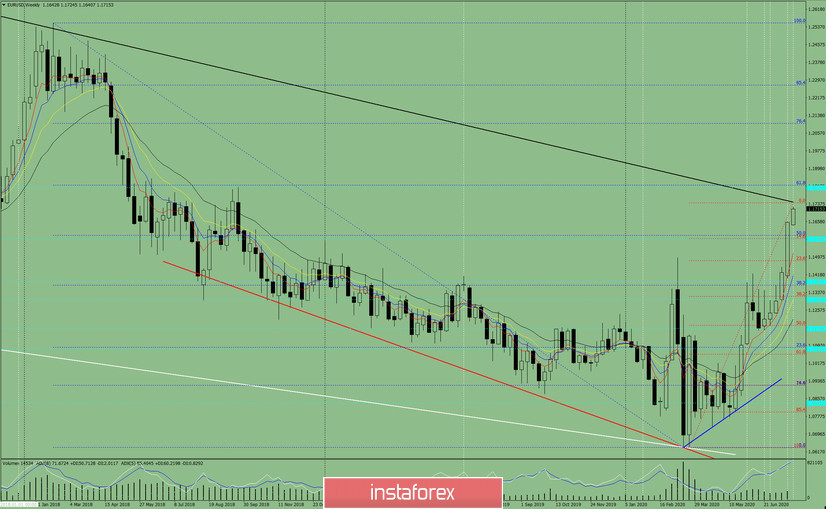
Fig. 1 (weekly chart).
Comprehensive analysis:
- indicator analysis - up;
- Fibonacci levels - up;
- volumes - up;
- candlestick analysis - down;
- trend analysis - up;
- Bollinger lines - up;
- monthly chart - up.
The conclusion based on a comprehensive analysis is an upward movement.
The general result of the calculation of the candlestick of the EUR/USD currency pair according to the weekly chart: the price on the week is likely to be in an upward trend with no lower shadow on the weekly white candlestick (Monday up) and no second upper shadow (Friday up).
The upper target at 1.1746 is the resistance line (black bold line). Upon reaching this level, we can continue to further work downward with the target of 1.1581 - a pullback level of 14.6% (red dotted line).
An alternative scenario: when moving up and reaching the level of 1.1746 - the resistance line (black bold line), the price may continue to work upward, with the target at 1.1820 - the 61.8% pullback level (blue dashed line).
Díky analytickým přehledům společnosti InstaForex získáte plné povědomi o tržních trendech! Jako zákazníkovi společnosti InstaForex je Vám k dispozici velký počet bezplatných služeb umožňujících efektivní obchodování.


