 Zůstat
Obchodní podmínky
Nástroje


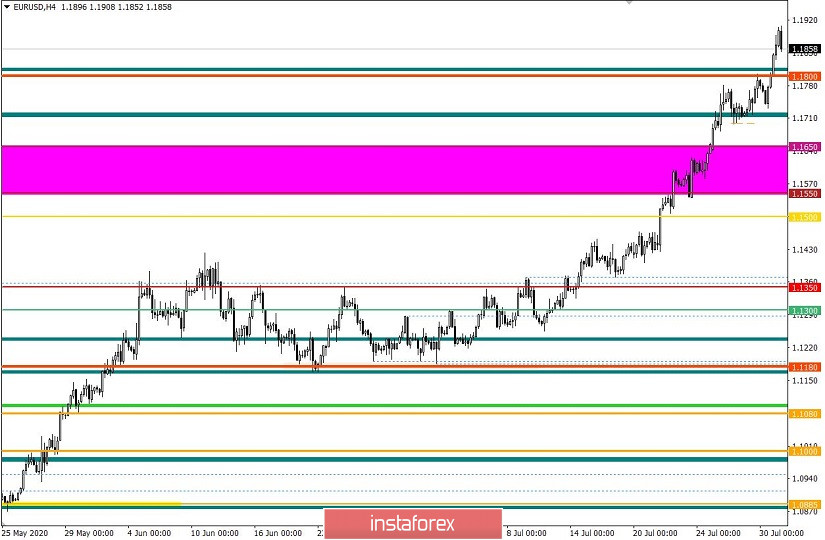
The current trading week is coming to an end. If we review all the movement starting from the beginning of the week, we will see that the change in the medium-term downward trend is no longer something theoretical, but rather a fact in the market. The breakout of quotes in the area of 1.1550 / 1.1650 was a signal of major changes in the market, and the rate of change in quotes is very alarming.
July was the second most active month after March, with which the quote managed to form such significant market changes in just a short period of time. Unfortunately, as before, a high rate of change in quotes lead to new bursts of activity, but only in the opposite direction. Thus, in order for the trend to be stable, the market needs a correction, but such will cause overheating of trading positions, which results in instability of the entire market structure.
Thus, the current bullish speculative mood can change into a bearish one, if one of these reasons occur (technical correction, external background, consolidation).
Analyzing the last trading day by minute, we can see that at the start of the European session, the quote tried to undergo a correction, but at the start of the American session, a round of long positions appeared, which led to the renewal of local highs.
As a result, a high rate of volatility at 117 points was recorded, which is 46% higher than the average value. Such acceleration has been registered for the second week already, which indicates a high speculative mood in the market.
Looking at the trading chart in general terms (daily period), we can see the breakdown of the June and September 2018 highs, with which 33% is left before the quote fully reaches the medium-term trend last 2018.
Meanwhile, the news published yesterday included data on the US GDP for the second quarter, in which the GDP contracted -32.9% (q / q), and fell by almost 10% (-9.5%) y / y.
Data on applications for unemployment benefits was also reported, with which initial applications increased from 1,422,000 to 1,434,000 (+12 thousand), while repeated applications increased from 16,151,000 to 17,018,000 (+867 thousand).
Such confirms the fact that the situation with the coronavirus in the United States is not better, as well as the state of the labor market, which is directly reflected in the US dollar.
Today, data on EU GDP will be released, forecasts of which are no better than the US. Everyone is expecting a decline, so, on an annualized basis, GDP may decrease by -14.7%, which is significantly higher with a minus sign than that of the United States. In quarterly terms, the decline may amount to -12.5%, but this does not change the situation that everything is bad.
Data on inflation in Europe was also expected, where they also forecast a decline from 0.3% to 0.2%.

The upcoming trading week will be full of events such as the release of PMI and retail sales in the EU, and the report of ADP and US Department of Labor on the US labor market. Important issues such as the coronavirus, Brexit and stimulus measures to support the economy will also be monitored.
Monday, August 3
EU 09:00 - Manufacturing PMI (July)
US 15:00 - ISM Business Activity Index (manufacturing sector) (July)
Tuesday, August 4
US 15:00 - Volume of industrial orders (June)
Wednesday, August 5
EU 10:00 - Retail Sales (July)
US 13:30 - ADP Employment Report (private sector) (July)
US 15:00 - ISM Business Activity Index (services sector) (July)
Thursday, August 6
US 13:30 - Applications for unemployment benefits
Friday, August 7
US 13:30 - Unemployment Report (from US Department of Labor)
- Change in the number of people employed in the non-agricultural sector
- Unemployment rate
- Average hourly wages
Further development
Analyzing the current trading chart, we can see a slight pullback in quotes, probably due to the overheating of long positions, as well as the upcoming data for Europe. The current pullback should turn into a full-scale correction of about 20-30% relative to the upward move in the market, but speculators can use the upcoming EU GDP data to turn it into a regrouping of trade forces.
Unfortunately, such will further exacerbate the overheating of long positions, which is likely to have a negative impact in the future, with which a collapse may occur.
Thus, based on the above information, we present these trading recommendations:
- Open sell transactions at positions lower than 1.1850, in the direction of 1.1800 - 1.1700 --- 1.1650.
- Open buy transactions at positions higher than 1.1915, in the direction of 1.1980.
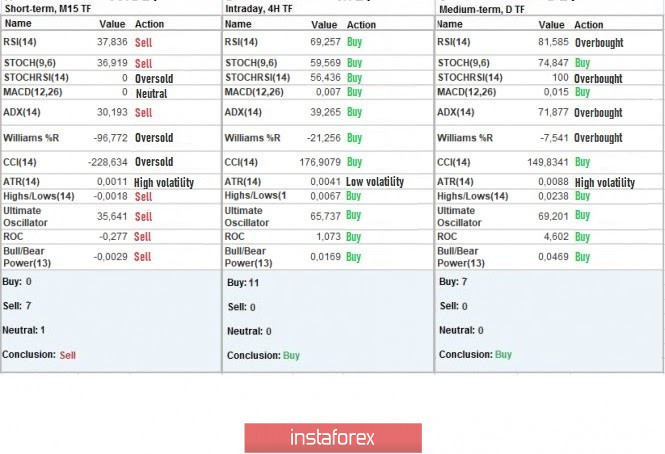
Indicator analysis
Analyzing the different sectors of time frames (TF), we can see that the indicators of technical instruments on the minute period signal "sell" due to the rollback in quotes, while the hourly and daily periods, as before, signal "buy" due to the upward trend.
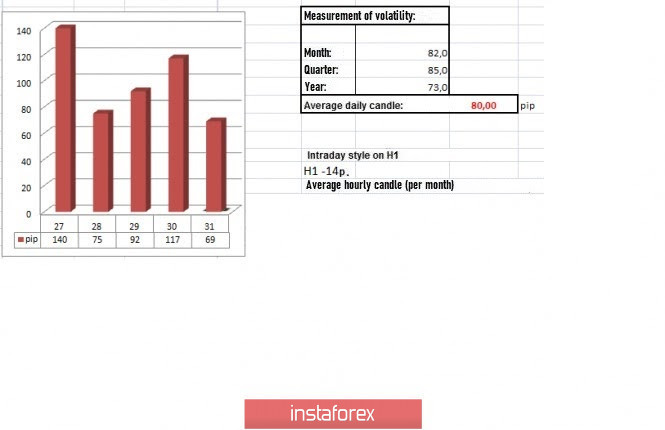
Weekly volatility / Volatility measurement: Month; Quarter; Year
The measurement of volatility reflects the average daily fluctuation, calculated per Month / Quarter / Year.
(July 31 was built, taking into account the time the article is published)
The volatility at this current time is 69 points, which is 13% below the average daily value.
It is assumed that volatility will remain high, due to the speculative mood of market participants and latest news on Europe and the US.
Key levels
Resistance zones: 1.2000 ***; 1.2100 *; 1.2450 **.
Support Zones: 1.1800 **; 1.1650 *; 1.1500; 1.1350; 1.1250 *; 1.1.180 **; 1.1080; 1.1000 ***; 1.0850 **; 1.0775 *; 1.0650 (1.0636); 1.0500 ***; 1.0350 **; 1.0000 ***.
* Periodic level
** Range level
*** Psychological level
Also check the trading recommendation for the GBP / USD pair here .
Díky analytickým přehledům společnosti InstaForex získáte plné povědomi o tržních trendech! Jako zákazníkovi společnosti InstaForex je Vám k dispozici velký počet bezplatných služeb umožňujících efektivní obchodování.


