 Zůstat
Obchodní podmínky
Nástroje


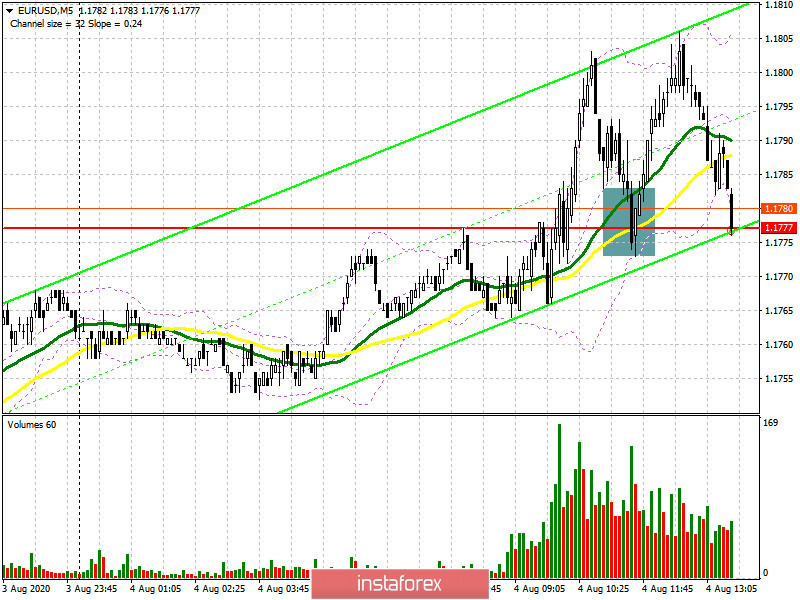
To open long positions on EURUSD, you need:
In the morning forecast, I paid attention to the option of breaking through the level of 1.1777 and buying the euro above this range. There was even a good signal for entering long positions, but so far, there has not been a larger upward movement, and another attempt by buyers to break above this range may end in failure. Let's look at the 5-minute chart and analyze the entry point in more detail. You can see how after the breakout of the resistance of 1.1777, the price returns to this level and tests it from the top down, which forms a good signal to buy the euro. However, it was not possible to extract more than 25 points from the new movement. A repeated return to this range may lead to the withdrawal of buyers from the market, so I recommend that you refrain from buying in the area of this area when it breaks. Only the next formation of a false breakout at the level of 1.1777 will serve as an additional signal to open long positions, the key goal of which is the resistance of 1.1840, where I recommend fixing the profits. The task of the bulls for the middle of the week is to update the maximum of 1.1906. If buyers miss 1.1777 in the second half of the day, and all this goes, I recommend to postpone a long position to test a minimum of 1.1704 or buy the EUR/USD immediately on the rebound from the major support of 1.1648, just above which is the lower boundary of a new downward trend channel based on the rebound in 25-30 points intraday.
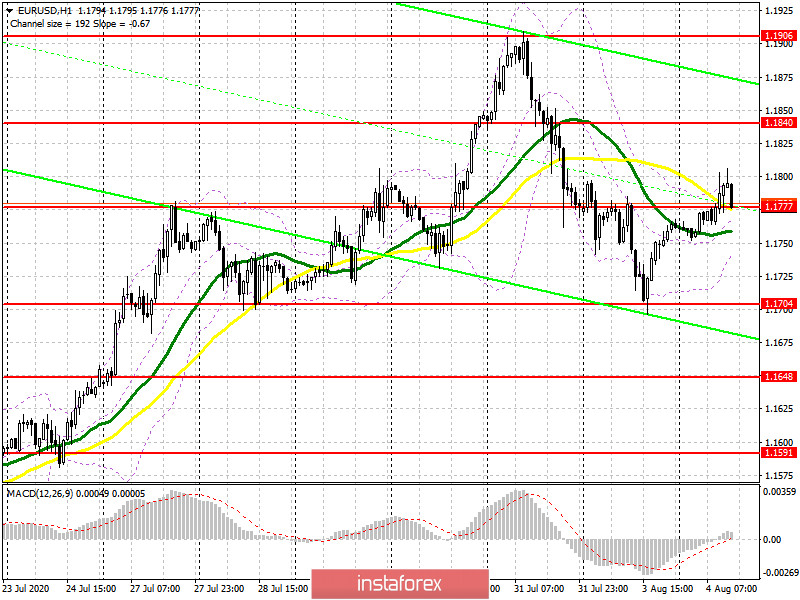
To open short positions on EURUSD, you need:
Bears gave buyers a chance to feel the resistance of 1.1777, however, they have not yet allowed them to build a new large wave of growth from this range. The task for the second half of the day will be to return EUR/USD to the level of 1.1777, which will lead to the demolition of stop orders of bulls and a larger movement of the euro down to the support of 1.1704, where I recommend fixing the profits. Accordingly, fixing below the level of 1.1777 is a direct sell signal. However, the longer-term goal remains the test of the minimum of 1.1648, the update of which will be a clear indication of the presence of a large seller on the market. If the growth of EUR/USD continues in the second half of the day, and the release of important fundamental statistics is not planned, so that you can focus on something, most likely, the bears will show themselves only after the formation of a false breakout in the resistance area of 1.1840. But I recommend selling the euro immediately for a rebound only from the maximum of 1.1906, counting on a correction of 25-30 points within the day.
Signals of indicators:
Moving averages
Trading is conducted in the area of 30 and 50 daily moving averages, which indicates an active confrontation between buyers and sellers.
Note: The period and prices of moving averages are considered by the author on the hourly chart H1 and differ from the general definition of the classic daily moving averages on the daily chart D1.
Bollinger Bands
A break in the lower border of the indicator around 1.1745 will lead to a larger fall in the euro.
Description of indicators
Díky analytickým přehledům společnosti InstaForex získáte plné povědomi o tržních trendech! Jako zákazníkovi společnosti InstaForex je Vám k dispozici velký počet bezplatných služeb umožňujících efektivní obchodování.

